Aflac 2009 Annual Report Download - page 72
Download and view the complete annual report
Please find page 72 of the 2009 Aflac annual report below. You can navigate through the pages in the report by either clicking on the pages listed below, or by using the keyword search tool below to find specific information within the annual report.-
 1
1 -
2
-
3
-
4
-
5
-
6
-
7
-
8
-
9
-
10
-
11
-
12
-
13
-
14
-
15
-
16
-
17
-
18
-
19
-
20
-
21
-
22
-
23
-
24
-
25
-
26
-
27
-
28
-
29
-
30
-
31
-
32
-
33
-
34
-
35
-
36
-
37
-
38
-
39
-
40
-
41
-
42
-
43
-
44
-
45
-
46
-
47
-
48
-
49
-
50
-
51
-
52
-
53
-
54
-
55
-
56
-
57
-
58
-
59
-
60
-
61
-
 62
62 -
 63
63 -
 64
64 -
 65
65 -
 66
66 -
 67
67 -
 68
68 -
 69
69 -
 70
70 -
 71
71 -
 72
72 -
 73
73 -
 74
74 -
 75
75 -
 76
76 -
 77
77 -
 78
78 -
 79
79 -
 80
80 -
 81
81 -
 82
82 -
83
-
84
-
85
-
86
-
87
-
88
-
89
-
90
-
91
-
92
-
93
-
94
-
95
-
96
-
97
-
98
 |
 |

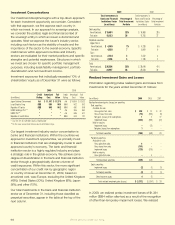
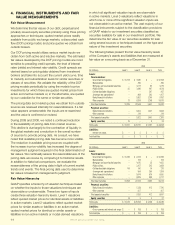
investments in perpetual securities that are rated below
investment grade are evaluated for other-than-temporary
impairment using our equity impairment model. Our equity
impairment model focuses on the severity of a security’s
decline in fair value coupled with the length of time the fair
value of the security has been below amortized cost.
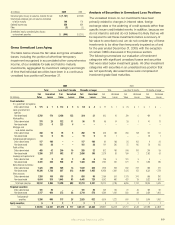
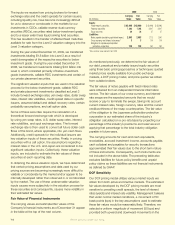
The following table details our pretax impairment losses by
investment category for the years ended December 31.
(In millions) 2009 2008 2007
Perpetual securities $ 729 $ 379 $ –
Corporate bonds 458 160 20
Collateralized debt obligations 148 213 –
Collateralized mortgage obligations 24 – 2
Equity securities 2 1 1
Total other-than-temporary impairments $ 1,361 $ 753 $ 23
As more fully discussed in the SEC Guidance section of
Note 1, we apply the debt security impairment model to our
perpetual securities provided there has been no evidence of
deterioration in credit of the issuer, such as a downgrade of
the rating of a perpetual security to below investment grade.
During 2009, the perpetual securities of seven issuers we
own were downgraded to below investment grade. As a
result of these downgrades, we were required to evaluate
these securities for other-than-temporary impairment using
the equity security impairment model rather than the debt
security impairment model. Use of the equity impairment
model limits the forecasted recovery period that can
be used in the impairment evaluation and, accordingly,
affects both the recognition and measurement of other-
than-temporary impairment losses. As a result of market
conditions and the extent of changes in ratings on our
perpetual securities, we recognized other-than-temporary
impairment losses for perpetual securities being evaluated
under our equity impairment model of $729 million ($474
million after-tax) during 2009.
During our review of certain CMOs, we determined that
a portion of the other-than-temporary impairment of the
securities was credit-related. However, we concluded
a portion of the reduction in fair value below amortized
cost was due to non-credit factors, which we believe we
will recover. As a result, we recognized an impairment
charge in earnings for credit-related declines in value of
$24 million ($15 million after-tax) during 2009. We recorded
an unrealized loss in other comprehensive income of $26
million ($17 million after-tax) during 2009 for the portion of
the other-than-temporary impairment of these securities
resulting from non-credit factors. We recorded an unrealized
gain of $1 million in other comprehensive income for some
of these CMOs to reect the change in fair value subsequent
to their other-than-temporary impairment recognized earlier
in the year.
The other-than-temporary impairment losses recognized
during 2009, of which a portion was transferred to other
comprehensive income, related only to the other-than-
temporary impairment of certain of our investments in
CMOs. The other-than-temporary impairment charges
related to credit and all other factors other than credit were
determined using statistical modeling techniques. The model
projects expected cash ows from the underlying mortgage
pools assuming various economic recession scenarios
including, more signicantly, geographical and regional
home data, housing valuations, prepayment speeds,
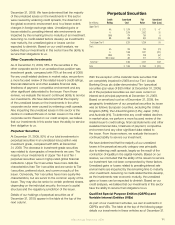
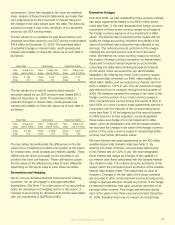
and economic recession statistics. The following table
summarizes credit-related impairment losses on securities
for which other-than-temporary losses were recognized
during 2009 and only the amount related to credit loss was
recognized in earnings.
(In millions) 2009
Balance of credit loss impairments, beginning of period $ –
Credit losses for which an other-than-temporary impairment
was not previously recognized 24
Credit losses for which an other-than-temporary impairment
was previously recognized –
Balance of credit loss impairments, end of period $ 24
Unrealized Investment Gains and Losses
Information regarding changes in unrealized gains and
losses from investments for the years ended December 31
follows:
(In millions) 2009 2008 2007
Changes in unrealized gains (losses):
Debt securities:
Available for sale $ 170 $ (2,134) $ (838)
Transferred to held to maturity (31) (165) (35)
Perpetual securities:
Available for sale 736 (850) –
Equity securities (1) (3) (3)
Total change in unrealized gains (losses) $ 874 $ (3,152) $ (876)
Effect on Shareholders’ Equity
The net effect on shareholders’ equity of unrealized gains
and losses from investment securities at December 31
appears in the table at the top of the following page.
We’ve got you under our wing.
68