Aflac 2009 Annual Report Download - page 75
Download and view the complete annual report
Please find page 75 of the 2009 Aflac annual report below. You can navigate through the pages in the report by either clicking on the pages listed below, or by using the keyword search tool below to find specific information within the annual report.-
 1
1 -
2
-
3
-
4
-
5
-
6
-
7
-
8
-
9
-
10
-
11
-
12
-
13
-
14
-
15
-
16
-
17
-
18
-
19
-
20
-
21
-
22
-
23
-
24
-
25
-
26
-
27
-
28
-
29
-
30
-
31
-
32
-
33
-
34
-
35
-
36
-
37
-
38
-
39
-
40
-
41
-
42
-
43
-
44
-
45
-
46
-
47
-
48
-
49
-
50
-
51
-
52
-
53
-
54
-
55
-
56
-
57
-
58
-
59
-
60
-
61
-
62
-
63
-
64
-
 65
65 -
 66
66 -
 67
67 -
 68
68 -
 69
69 -
 70
70 -
 71
71 -
 72
72 -
 73
73 -
 74
74 -
 75
75 -
 76
76 -
 77
77 -
 78
78 -
 79
79 -
 80
80 -
 81
81 -
 82
82 -
 83
83 -
 84
84 -
 85
85 -
86
-
87
-
88
-
89
-
90
-
91
-
92
-
93
-
94
-
95
-
96
-
97
-
98
 |
 |

December 31, 2008. We have determined that the majority
of the unrealized losses on the investments in this sector
were caused by widening credit spreads, the downturn in
the global economic environment and, to a lesser extent,
changes in foreign exchange rates. Unrealized gains or
losses related to prevailing interest rate environments are
impacted by the remaining time to maturity of an investment.
Assuming no credit-related factors develop, as investments
near maturity, the unrealized gains or losses can be
expected to diminish. Based on our credit analysis, we
believe that our investments in this sector have the ability to
service their obligations to us.
Other Corporate Investments
As of December 31, 2009, 58% of the securities in the
other corporate sector in an unrealized loss position was
investment grade, compared with 70% at the end of 2008.
For any credit-related declines in market value, we perform
a more focused review of the related issuer’s credit ratings,
nancial statements and other available nancial data,
timeliness of payment, competitive environment and any
other signicant data related to the issuer. From those
reviews, we evaluate the issuers’ continued ability to service
our investments. We have determined that the majority
of the unrealized losses on the investments in the other
corporate sector were caused by widening credit spreads.
Also impacting the unrealized losses in this sector is the
decline in creditworthiness of certain issuers in the other
corporate sector. Based on our credit analysis, we believe
that our investments in this sector have the ability to service
their obligation to us.
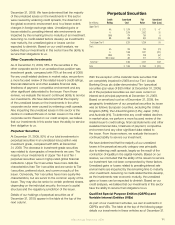
Perpetual Securities
At December 31, 2009, 92% of our total investments in
perpetual securities in an unrealized loss position was
investment grade, compared with 96% at December
31, 2008. The decrease in investment-grade securities
was related to downgrades of investments we own. The
majority of our investments in Upper Tier II and Tier I
perpetual securities were in highly-rated global nancial
institutions. Upper Tier II securities have more debt-like
characteristics than Tier I securities and are senior to Tier
I securities, preferred stock, and common equity of the
issuer. Conversely, Tier I securities have more equity-like
characteristics, but are senior to the common equity of the
issuer. They may also be senior to certain preferred shares,
depending on the individual security, the issuer’s capital
structure and the regulatory jurisdiction of the issuer.
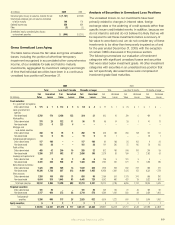
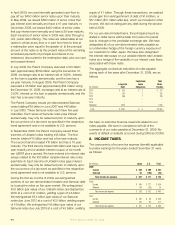
Details of our holdings of perpetual securities as of
December 31, 2009, appear in the table at the top of the
next column.
Perpetual Securities
Credit Amortized Fair Unrealized
(In millions) Rating Cost Value Gain (Loss)
Upper Tier II:
AA $ 1,074 $ 1,121 $ 47
A 2,514 2,552 38
BBB 774 780 6
BB 838 803 (35)
Total Upper Tier II 5,200 5,256 56
Tier I:
AA 329 255 (74)
A 1,308 1,027 (281)
BBB 275 208 (67)
BB or lower 442 517 75
Total Tier I 2,354 2,007 (347)
Total $ 7,554 $ 7,263 $ (291)
With the exception of the Icelandic bank securities that
we completely impaired in 2008 and our Tier I Lloyds
Banking Group plc dollar-denominated Tier I perpetual
securities (par value of $33 million at December 31, 2009),
all of the perpetual securities we own were current on
interest and principal payments at December 31, 2009.
Based on amortized cost as of December 31, 2009, the
geographic breakdown of our perpetual securities by issuer
was as follows: European countries, excluding the United
Kingdom (68%); the United Kingdom (14%); Japan (14%);
and Australia (4%). To determine any credit-related declines
in market value, we perform a more focused review of the
related issuer’s credit ratings, nancial statements and other
available nancial data, timeliness of payment, competitive
environment and any other signicant data related to
the issuer. From those reviews, we evaluate the issuer’s
continued ability to service our investment.
We have determined that the majority of our unrealized
losses in the perpetual security category was principally
due to widening credit spreads, largely as the result of the
contraction of liquidity in the capital markets. Based on our
reviews, we concluded that the ability of the issuers to service
our investment has not been compromised by these factors.
Unrealized gains or losses related to prevailing interest rate
environments are impacted by the remaining time to maturity
of an investment. Assuming no credit-related factors develop,
as the investments near economic maturity, the unrealized
gains or losses can be expected to diminish. Based on our
credit analyses, we believe that our investments in this sector
have the ability to service their obligations to us.
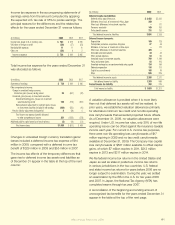
Qualied Special Purpose Entities (QSPEs) and
Variable Interest Entities (VIEs)
As part of our investment activities, we own investments in
QSPEs and VIEs. The table at the top of the following page
details our investments in these vehicles as of December 31.
Aflac Annual Report for 2009 71