Aflac 2009 Annual Report Download - page 68
Download and view the complete annual report
Please find page 68 of the 2009 Aflac annual report below. You can navigate through the pages in the report by either clicking on the pages listed below, or by using the keyword search tool below to find specific information within the annual report.-
 1
1 -
2
-
3
-
4
-
5
-
6
-
7
-
8
-
9
-
10
-
11
-
12
-
13
-
14
-
15
-
16
-
17
-
18
-
19
-
20
-
21
-
22
-
23
-
24
-
25
-
26
-
27
-
28
-
29
-
30
-
31
-
32
-
33
-
34
-
35
-
36
-
37
-
38
-
39
-
40
-
41
-
42
-
43
-
44
-
45
-
46
-
47
-
48
-
49
-
50
-
51
-
52
-
53
-
54
-
55
-
56
-
57
-
 58
58 -
 59
59 -
 60
60 -
 61
61 -
 62
62 -
 63
63 -
 64
64 -
 65
65 -
 66
66 -
 67
67 -
 68
68 -
 69
69 -
 70
70 -
 71
71 -
 72
72 -
 73
73 -
 74
74 -
 75
75 -
 76
76 -
 77
77 -
 78
78 -
79
-
80
-
81
-
82
-
83
-
84
-
85
-
86
-
87
-
88
-
89
-
90
-
91
-
92
-
93
-
94
-
95
-
96
-
97
-
98
 |
 |

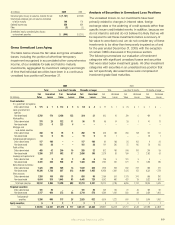
Investment Holdings
The amortized cost for our investments in debt and
perpetual securities, the cost for equity securities and the
fair values of these investments at December 31 are shown
in the following table.
2009 2008
Cost Gross Gross Cost Gross Gross
or Amortized Unrealized Unrealized Fair or Amortized Unrealized Unrealized Fair
(In millions) Cost Gains Losses Value Cost Gains Losses Value
Securities available for sale, carried at fair value:
Fixed maturities:
Yen-denominated:
Japan government and agencies $ 11,710 $ 405 $ 174 $ 11,941 $ 11,153 $ 988 $ 16 $ 12,125
Mortgage- and asset-backed securities 549 13 – 562 491 8 – 499
Public utilities 2,284 145 79 2,350 2,282 188 17 2,453
Collateralized debt obligations 165 97 24 238 253 6 – 259
Sovereign and supranational 833 28 96 765 943 37 126 854
Banks/financial institutions 5,248 144 784 4,608 4,667 81 686 4,062
Other corporate 6,401 112 714 5,799 6,183 155 576 5,762
Total yen-denominated 27,190 944 1,871 26,263 25,972 1,463 1,421 26,014
Dollar-denominated:
U.S. government and agencies 221 3 7 217 266 6 1 271
Municipalities 519 4 28 495 119 1 14 106
Mortgage- and asset-backed securities* 586 9 78 517 738 7 189 556
Collateralized debt obligations 24 7 2 29 53 – 37 16
Public utilities 1,587 123 42 1,668 1,337 34 165 1,206
Sovereign and supranational 353 48 9 392 366 44 9 401
Banks/financial institutions 2,668 75 259 2,484 2,910 107 529 2,488
Other corporate 4,485 339 108 4,716 4,273 182 501 3,954
Total dollar-denominated 10,443 608 533 10,518 10,062 381 1,445 8,998
Total fixed maturities 37,633 1,552 2,404 36,781 36,034 1,844 2,866 35,012
Perpetual securities:
Yen-denominated:
Banks/financial institutions 6,964 311 604 6,671 8,400 187 1,091 7,496
Other corporate 291 28 – 319 294 13 – 307
Dollar-denominated:
Banks/financial institutions 299 30 56 273 380 – 136 244
Total perpetual securities 7,554 369 660 7,263 9,074 200 1,227 8,047
Equity securities 22 4 2 24 24 5 2 27
Total securities available for sale $ 45,209 $ 1,925 $ 3,066 $ 44,068 $ 45,132 $ 2,049 $ 4,095 $ 43,086
Securities held to maturity, carried at amortized cost:
Fixed maturities:
Yen-denominated:
Japan government and agencies $ 217 $ 6 $ – $ 223 $ 220 $ 17 $ – $ 237
Municipalities 281 1 4 278 – – – –
Mortgage- and asset-backed securities 167 2 6 163 75 1 1 75
Collateralized debt obligations 109 – 14 95 403 – 295 108
Public utilities 5,235 180 138 5,277 3,951 168 66 4,053
Sovereign and supranational 4,248 161 143 4,266 3,582 93 132 3,543
Banks/financial institutions 11,775 140 984 10,931 12,291 147 1,195 11,243
Other corporate 4,455 142 104 4,493 3,714 145 84 3,775
Total yen-denominated 26,487 632 1,393 25,726 24,236 571 1,773 23,034
Dollar-denominated:
Collateralized debt obligations 200 – 98 102 200 – 150 50
Total dollar-denominated 200 – 98 102 200 – 150 50
Total securities held to maturity $ 26,687 $ 632 $ 1,491 $ 25,828 $ 24,436 $ 571 $ 1,923 $ 23,084
* Includes $25 of other-than-temporary non-credit related losses
We’ve got you under our wing.
64