Aflac 2009 Annual Report Download - page 47
Download and view the complete annual report
Please find page 47 of the 2009 Aflac annual report below. You can navigate through the pages in the report by either clicking on the pages listed below, or by using the keyword search tool below to find specific information within the annual report.-
 1
1 -
2
-
3
-
4
-
5
-
6
-
7
-
8
-
9
-
10
-
11
-
12
-
13
-
14
-
15
-
16
-
17
-
18
-
19
-
20
-
21
-
22
-
23
-
24
-
25
-
26
-
27
-
28
-
29
-
30
-
31
-
32
-
33
-
34
-
35
-
36
-
 37
37 -
 38
38 -
 39
39 -
 40
40 -
 41
41 -
 42
42 -
 43
43 -
 44
44 -
 45
45 -
 46
46 -
 47
47 -
 48
48 -
 49
49 -
 50
50 -
 51
51 -
 52
52 -
 53
53 -
 54
54 -
 55
55 -
 56
56 -
 57
57 -
58
-
59
-
60
-
61
-
62
-
63
-
64
-
65
-
66
-
67
-
68
-
69
-
70
-
71
-
72
-
73
-
74
-
75
-
76
-
77
-
78
-
79
-
80
-
81
-
82
-
83
-
84
-
85
-
86
-
87
-
88
-
89
-
90
-
91
-
92
-
93
-
94
-
95
-
96
-
97
-
98
 |
 |

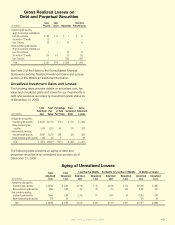
See Note 3 of the Notes to the Consolidated Financial
Statements and the Realized Investment Gains and Losses
section of this MD&A for additional information.
Unrealized Investment Gains and Losses
The following table provides details on amortized cost, fair
value and unrealized gains and losses for our investments in
debt and perpetual securities by investment-grade status as
of December 31, 2009.
The following table presents an aging of debt and
perpetual securities in an unrealized loss position as of
December 31, 2009.
Total Total Percentage Gross Gross
Amortized Fair of Total Unrealized Unrealized
(In millions) Cost Value Fair Value Gains Losses
Available-for-sale securities:
Investment-grade securities $ 40,437 $ 40,113 57.4% $ 1,711 $ 2,035
Below-investment-grade
securities 4,750 3,931 5.6 210 1,029
Held-to-maturity securities:
Investment-grade securities 26,487 25,726 36.8 632 1,393
Below-investment-grade securities 200 102 .2 – 98
Total $ 71,874 $ 69,872 100.0% $ 2,553 $ 4,555
Gross Realized Losses on
Debt and Perpetual Securities
Sales Sales Total Gross
(In millions)
Proceeds Losses Impairments Realized Losses
Investment-grade securities,
length of consecutive unrealized loss:
Less than six months $ 180 $ 14 $ – $ 14
Six months to 12 months 13 – – –
Over 12 months 52 4 10 14
Below-investment-grade securities,
length of consecutive unrealized loss:
Less than six months 1 – 20 20
Six months to 12 months 315 101 34 135
Over 12 months – – 1,295 1,295
Total $ 561 $ 119 $ 1,359 $ 1,478
Aging of Unrealized Losses
Total Total Less than Six Months Six Months to Less than 12 Months 12 Months or Longer
Amortized Unrealized Amortized Unrealized Amortized Unrealized Amortized Unrealized
(In millions) Cost Loss Cost Loss Cost Loss Cost Loss
Available-for-sale securities:
Investment-grade securities $ 20,160 $ 2,035 $ 2,519 $ 40 $ 4,946 $ 175 $ 12,695 $ 1,820
Below-investment-grade securities 3,539 1,029 407 28 704 350 2,428 651
Held-to-maturity securities:
Investment-grade securities 16,466 1,393 2,151 81 1,661 42 12,654 1,270
Below-investment-grade securities 200 98 – – – – 200 98
Total $ 40,365 $ 4,555 $ 5,077 $ 149 $ 7,311 $ 567 $ 27,977 $ 3,839
Aflac Annual Report for 2009 43