Aflac 2009 Annual Report Download - page 43
Download and view the complete annual report
Please find page 43 of the 2009 Aflac annual report below. You can navigate through the pages in the report by either clicking on the pages listed below, or by using the keyword search tool below to find specific information within the annual report.-
 1
1 -
2
-
3
-
4
-
5
-
6
-
7
-
8
-
9
-
10
-
11
-
12
-
13
-
14
-
15
-
16
-
17
-
18
-
19
-
20
-
21
-
22
-
23
-
24
-
25
-
26
-
27
-
28
-
29
-
30
-
31
-
32
-
 33
33 -
 34
34 -
 35
35 -
 36
36 -
 37
37 -
 38
38 -
 39
39 -
 40
40 -
 41
41 -
 42
42 -
 43
43 -
 44
44 -
 45
45 -
 46
46 -
 47
47 -
 48
48 -
 49
49 -
 50
50 -
 51
51 -
 52
52 -
 53
53 -
54
-
55
-
56
-
57
-
58
-
59
-
60
-
61
-
62
-
63
-
64
-
65
-
66
-
67
-
68
-
69
-
70
-
71
-
72
-
73
-
74
-
75
-
76
-
77
-
78
-
79
-
80
-
81
-
82
-
83
-
84
-
85
-
86
-
87
-
88
-
89
-
90
-
91
-
92
-
93
-
94
-
95
-
96
-
97
-
98
 |
 |

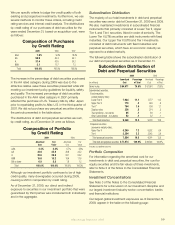
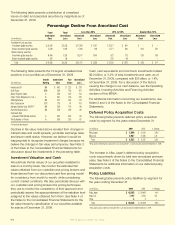
We use specic criteria to judge the credit quality of both
existing and prospective investments. Furthermore, we use
several methods to monitor these criteria, including credit
rating services and internal credit analysis. The distributions
by credit rating of our purchases of debt securities for the
years ended December 31, based on acquisition cost, were
as follows:
The increase in the percentage of debt securities purchased
in the AA rated category during 2009 was due to the
attractive relative value these securities presented while still
meeting our investment policy guidelines for liquidity, safety
and quality. The increased percentage of debt securities
purchased in the AAA rated category in 2007 primarily
reected the purchase of U.S. Treasury bills by Aac Japan
prior to repatriating prots to Aac U.S. in the third quarter of
2007. We did not purchase any perpetual securities during
the periods presented in the table above.
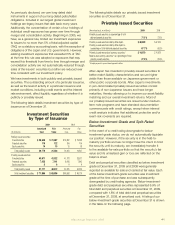
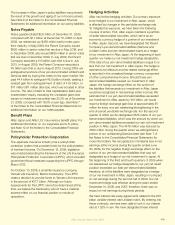
The distributions of debt and perpetual securities we own,
by credit rating, as of December 31 were as follows:
Although our investment portfolio continues to be of high
credit quality, many downgrades occurred during 2009,
causing a shift in composition by credit rating.
As of December 31, 2009, our direct and indirect
exposure to securities in our investment portfolio that were
guaranteed by third parties was immaterial both individually
and in the aggregate.
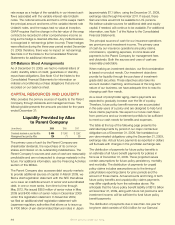
Subordination Distribution
The majority of our total investments in debt and perpetual
securities was senior debt at December 31, 2009 and 2008.
We also maintained investments in subordinated nancial
instruments that primarily consisted of Lower Tier II, Upper
Tier II, and Tier I securities, listed in order of seniority. The
Lower Tier II (LTII) securities are debt instruments with xed
maturities. Our Upper Tier II (UTII) and Tier I investments
consisted of debt instruments with xed maturities and
perpetual securities, which have an economic maturity as
opposed to a stated maturity.
The following table shows the subordination distribution of
our debt and perpetual securities as of December 31.
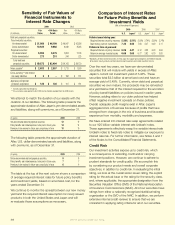
Portfolio Composition
For information regarding the amortized cost for our
investments in debt and perpetual securities, the cost for
equity securities and the fair values of these investments,
refer to Note 3 of the Notes to the Consolidated Financial
Statements.
Investment Concentrations
See Note 3 of the Notes to the Consolidated Financial
Statements for a discussion of our investment discipline and
our largest investment industry sector concentration, banks
and nancial institutions.
Our largest global investment exposures as of December 31,
2009, appear in the table on the following page:
Composition of Purchases
by Credit Rating
2009 2008 2007
AAA 7.6% 9.9% 18.4%
AA 58.9 36.4 44.1
A 31.4 42.0 30.2
BBB 2.1 11.7 7.3
Total 100.0% 100.0% 100.0%
Composition of Portfolio
by Credit Rating
2009 2008
Amortized Fair Amortized Fair
Cost Value Cost Value
AAA 3.3% 3.4% 5.7% 5.8%
AA 34.6 35.8 39.8 42.2
A 39.6 39.8 34.1 33.2
BBB 15.6 15.2 18.6 17.6
BB or lower 6.9 5.8 1.8 1.2
Total 100.0% 100.0% 100.0% 100.0%
Subordination Distribution of
Debt and Perpetual Securities
2009
2008
Amortized Percentage Amortized Percentage
(In millions) Cost of Total Cost of Total
Senior notes $ 54,971 76.5% $ 51,091 73.5%
Subordinated securities:
Fixed maturities
(stated maturity date):
Lower Tier II 7,944 11.1 7,777 11.2
Upper Tier II 178 .2 340 .5
Tier I* 754 1.0 750 1.1
Surplus notes 336 .5 374 .5
Trust preferred - non-banks 85 .1 86 .1
Other subordinated - non-banks 52 .1 52 .1
Total fixed maturities 9,349 13.0 9,379 13.5
Perpetual securities
(economic maturity date):
Upper Tier II 5,200 7.2 6,532 9.4
Tier I 2,354 3.3 2,542 3.6
Total perpetual securities 7,554 10.5 9,074 13.0
Total debt and perpetual securities $ 71,874 100.0% $ 69,544 100.0%
* Includes trust preferred securities
Aflac Annual Report for 2009 39