Aflac 2009 Annual Report Download - page 69
Download and view the complete annual report
Please find page 69 of the 2009 Aflac annual report below. You can navigate through the pages in the report by either clicking on the pages listed below, or by using the keyword search tool below to find specific information within the annual report.-
 1
1 -
2
-
3
-
4
-
5
-
6
-
7
-
8
-
9
-
10
-
11
-
12
-
13
-
14
-
15
-
16
-
17
-
18
-
19
-
20
-
21
-
22
-
23
-
24
-
25
-
26
-
27
-
28
-
29
-
30
-
31
-
32
-
33
-
34
-
35
-
36
-
37
-
38
-
39
-
40
-
41
-
42
-
43
-
44
-
45
-
46
-
47
-
48
-
49
-
50
-
51
-
52
-
53
-
54
-
55
-
56
-
57
-
58
-
 59
59 -
 60
60 -
 61
61 -
 62
62 -
 63
63 -
 64
64 -
 65
65 -
 66
66 -
 67
67 -
 68
68 -
 69
69 -
 70
70 -
 71
71 -
 72
72 -
 73
73 -
 74
74 -
 75
75 -
 76
76 -
 77
77 -
 78
78 -
 79
79 -
80
-
81
-
82
-
83
-
84
-
85
-
86
-
87
-
88
-
89
-
90
-
91
-
92
-
93
-
94
-
95
-
96
-
97
-
98
 |
 |

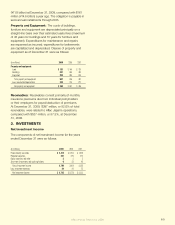
The methods of determining the fair values of our
investments in debt securities, perpetual securities and
equity securities are described in Note 4.
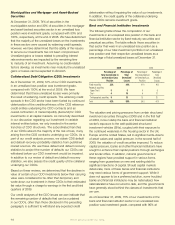
During 2009, we reclassied 12 investments from the held-
to-maturity portfolio to the available-for-sale portfolio as a
result of signicant declines in the issuers’ creditworthiness.
At the time of transfer, the securities had an aggregate
amortized cost of $1.3 billion and an aggregate unrealized
loss of $548 million.
During 2008, Lehman Brothers Special Financing Inc.
(LBSF), the swap counterparty under four of our CDO debt
securities, led for bankruptcy protection along with certain
of its afliates (including Lehman Brothers Holdings Inc.,
the guarantor of LBSF’s obligations relating to the CDOs).
We transferred these CDOs from the held-to-maturity
portfolio to the available-for-sale portfolio as a result of the
default by LBSF under the swaps. In connection with the
transfer, we took an impairment charge primarily related to
the foreign currency component of three of these CDOs
totaling $20 million ($13 million after-tax). This impairment
charge was included in realized investment losses during
2008. At the time of the transfer and after impairment
charges, these CDO debt securities had a total amortized
cost of $245 million and an unrealized gain of $3 million.
The unrealized gain related to the only CDO of the four
that was not impaired. In the fourth quarter of 2009, we
redeemed these four CDO securities and received the
underlying collateral assets.
We transferred four other debt securities from the held-to-
maturity portfolio to the available-for-sale portfolio during
2008 as a result of signicant deterioration in the issuers’
creditworthiness. At the time of the transfer, the securities
had an aggregate amortized cost of $268 million and an
aggregate unrealized loss of $131 million.
During 2007, we reclassied an investment from the held-
to-maturity portfolio to the available-for-sale portfolio
as a result of a signicant deterioration in the issuer’s
creditworthiness. At the date of transfer, this debt security
had an amortized cost of $169 million and an unrealized
loss of $8 million. The investment was subsequently sold at
a realized gain of $12 million.
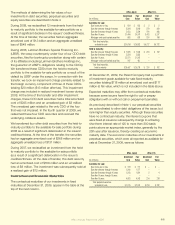
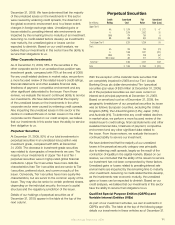
Contractual and Economic Maturities
The contractual maturities of our investments in xed
maturities at December 31, 2009, appear in the table at the
top of the next column.
Aflac Japan Aflac U.S.
Amortized Fair Amortized Fair
(In millions) Cost Value Cost Value
Available for sale:
Due in one year or less $ 624 $ 632 $ 5 $ 5
Due after one year through five years 5,384 5,840 279 309
Due after five years through 10 years 2,433 2,594 790 883
Due after 10 years 21,464 20,007 5,403 5,317
Mortgage- and asset-backed securities 883 879 250 198
Total fixed maturities
available for sale $ 30,788 $ 29,952 $ 6,727 $ 6,712
Held to maturity:
Due after one year through five years $ 1,595 $ 1,643 $ 200 $ 102
Due after five years through 10 years 2,554 2,853 – –
Due after 10 years 22,171 21,067 – –
Mortgage- and asset-backed securities 167 163 – –
Total fixed maturities
held to maturity $ 26,487 $ 25,726 $ 200 $ 102
At December 31, 2009, the Parent Company had a portfolio
of investment-grade available-for-sale xed-maturity
securities totaling $118 million at amortized cost and $117
million at fair value, which is not included in the table above.
Expected maturities may differ from contractual maturities
because some issuers have the right to call or prepay
obligations with or without call or prepayment penalties.
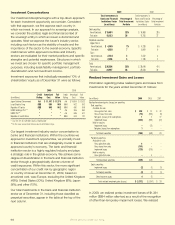
As previously described in Note 1, our perpetual securities
are subordinated to other debt obligations of the issuer, but
rank higher than equity securities. Although these securities
have no contractual maturity, the interest coupons that
were xed at issuance subsequently change to a oating
short-term interest rate of 125 to more than 300 basis
points above an appropriate market index, generally by the
25th year after issuance, thereby creating an economic
maturity date. The economic maturities of our investments in
perpetual securities, which were all reported as available for
sale at December 31, 2009, were as follows:
Aflac Japan Aflac U.S.
Amortized Fair Amortized Fair
(In millions) Cost Value Cost Value
Available for sale:
Due in one year or less $ 109 $ 111 $ – $ –
Due after one year through five years 1,060 1,177 – –
Due after five years through 10 years 1,543 1,691 5 4
Due after 10 years through 15 years – – – –
Due after 15 years 4,603 4,062 234 218
Total perpetual securities
available for sale $ 7,315 $ 7,041 $ 239 $ 222
Aflac Annual Report for 2009 65