Aflac 2009 Annual Report Download - page 35
Download and view the complete annual report
Please find page 35 of the 2009 Aflac annual report below. You can navigate through the pages in the report by either clicking on the pages listed below, or by using the keyword search tool below to find specific information within the annual report.-
 1
1 -
2
-
3
-
4
-
5
-
6
-
7
-
8
-
9
-
10
-
11
-
12
-
13
-
14
-
15
-
16
-
17
-
18
-
19
-
20
-
21
-
22
-
23
-
24
-
 25
25 -
 26
26 -
 27
27 -
 28
28 -
 29
29 -
 30
30 -
 31
31 -
 32
32 -
 33
33 -
 34
34 -
 35
35 -
 36
36 -
 37
37 -
 38
38 -
 39
39 -
 40
40 -
 41
41 -
 42
42 -
 43
43 -
 44
44 -
 45
45 -
46
-
47
-
48
-
49
-
50
-
51
-
52
-
53
-
54
-
55
-
56
-
57
-
58
-
59
-
60
-
61
-
62
-
63
-
64
-
65
-
66
-
67
-
68
-
69
-
70
-
71
-
72
-
73
-
74
-
75
-
76
-
77
-
78
-
79
-
80
-
81
-
82
-
83
-
84
-
85
-
86
-
87
-
88
-
89
-
90
-
91
-
92
-
93
-
94
-
95
-
96
-
97
-
98
 |
 |

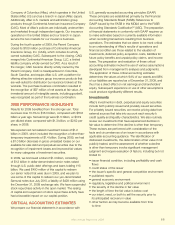
The percentage increases in premium income reect the
growth of premiums in force. The increases in annualized
premiums in force in yen of 3.3% in 2009, 3.2% in 2008
and 3.9% in 2007 reect the high persistency of Aac
Japan’s business and the sales of new policies. Annualized
premiums in force at December 31, 2009, were ¥1.20 trillion,
compared with ¥1.16 trillion in 2008 and ¥1.13 trillion in
2007. Annualized premiums in force, translated into dollars
at respective year-end exchange rates, were $13.0 billion in
2009, $12.8 billion in 2008, and $9.9 billion in 2007.
Aac Japan maintains a portfolio of dollar-denominated and
reverse-dual currency securities (yen-denominated debt
securities with dollar coupon payments). Dollar-denominated
investment income from these assets accounted for
approximately 33% of Aac Japan’s investment income in
2009, compared with 36% in 2008 and 39% in 2007. In
years when the yen strengthens in relation to the dollar,
translating Aac Japan’s dollar-denominated investment
income into yen lowers growth rates for net investment
income, total operating revenues, and pretax operating
earnings in yen terms. In years when the yen weakens,
translating dollar-denominated investment income into yen
magnies growth rates for net investment income, total
operating revenues, and pretax operating earnings in yen
terms. On a constant currency basis, dollar-denominated
investment income accounted for approximately 36% of
Aac Japan’s investment income during 2009, compared
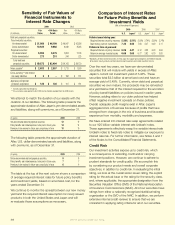
with 39% in 2008 and 2007. The following table illustrates
the effect of translating Aac Japan’s dollar-denominated
investment income and related items into yen by comparing
certain segment results with those that would have
been reported had yen/dollar exchange rates remained
unchanged from the prior year.
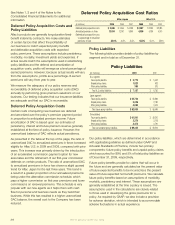
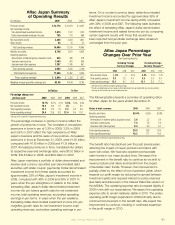
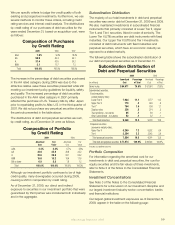
The following table presents a summary of operating ratios
for Aac Japan for the years ended December 31.
The benet ratio has declined over the past several years,
reecting the impact of newer products and riders with
lower loss ratios. We have also experienced favorable
claim trends in our major product lines. We expect the
improvement in the benet ratio to continue as we shift to
newer products and riders and benet from the impact
of favorable claim trends. However, this improvement is
partially offset by the effect of low investment yields, which
impacts our prot margin by reducing the spread between
investment yields and required interest on policy reserves
(see table and discussion in the Interest Rate Risk section of
this MD&A). The operating expense ratio increased slightly in
2009 in line with our expectations. We expect the operating
expense ratio to remain relatively stable in 2010. The pretax
operating prot margin expanded in 2009 primarily due to
continued improvement in the benet ratio. We expect this
improvement to continue, resulting in continued expansion
in the prot margin in 2010.
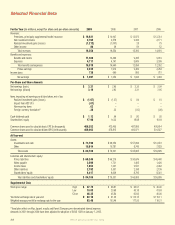
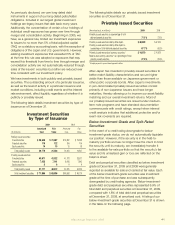
Aac Japan Summary
of Operating Results
(In millions) 2009 2008 2007
Premium income $ 12,178 $ 10,674 $ 9,037
Net investment income:
Yen-denominated investment income 1,510 1,312 1,102
Dollar-denominated investment income 755 741 699
Net investment income 2,265 2,053 1,801
Other income 43 15 27
Total operating revenues 14,486 12,742 10,865
Benefits and claims 8,746 7,972 6,935
Operating expenses:
Amortization of deferred policy acquisition costs 523 405 318
Insurance commissions 1,060 970 850
Insurance and other expenses 1,357 1,145 941
Total operating expenses 2,940 2,520 2,109
Total benefits and expenses 11,686 10,492 9,044
Pretax operating earnings* $ 2,800 $ 2,250 $ 1,821
Weighted-average yen/dollar exchange rate 93.49 103.46 117.93
In Dollars In Yen
Percentage change over
previous year: 2009 2008 2007 2009 2008 2007
Premium income 14.1% 18.1% 3.1% 3.3% 3.5% 4.3%
Net investment income 10.3 14.0 6.7 (.1) – 8.0
Total operating revenues 13.7 17.3 3.7 3.0 2.8 4.9
Pretax operating earnings* 24.4 23.6 10.2 12.4 8.4 11.8
*See Page 30 for our definition of segment operating earnings.
Aac Japan Percentage
Changes Over Prior Year
(Yen Operating Results)
Including Foreign Excluding Foreign
Currency Changes *Currency Changes**
2009 2008 2007 2009 2008 2007
Net investment income (.1)% –% 8.0% 3.4% 5.0% 7.4%
Total operating revenues 3.0 2.8 4.9 3.5 3.8 4.9
Pretax operating earnings* 12.4 8.4 11.8 15.1 13.8 11.3
*See Page 30 for our definition of segment operating earnings.
**Amounts excluding foreign currency changes on dollar-denominated items were determined using the same yen/dollar
**exchange rate for the current year as each respective prior year.
Ratios to total revenues: 2009 2008 2007
Benefits and claims 60.4% 62.5% 63.8%
Operating expenses:
Amortization of deferred policy acquisition costs 3.6 3.2 2.9
Insurance commissions 7.3 7.6 7.8
Insurance and other expenses 9.4 9.0 8.7
Total operating expenses 20.3 19.8 19.4
Pretax operating earnings* 19.3 17.7 16.8
*See Page 30 for our definition of segment operating earnings.
Aflac Annual Report for 2009 31