Aflac 2009 Annual Report Download - page 70
Download and view the complete annual report
Please find page 70 of the 2009 Aflac annual report below. You can navigate through the pages in the report by either clicking on the pages listed below, or by using the keyword search tool below to find specific information within the annual report.-
 1
1 -
2
-
3
-
4
-
5
-
6
-
7
-
8
-
9
-
10
-
11
-
12
-
13
-
14
-
15
-
16
-
17
-
18
-
19
-
20
-
21
-
22
-
23
-
24
-
25
-
26
-
27
-
28
-
29
-
30
-
31
-
32
-
33
-
34
-
35
-
36
-
37
-
38
-
39
-
40
-
41
-
42
-
43
-
44
-
45
-
46
-
47
-
48
-
49
-
50
-
51
-
52
-
53
-
54
-
55
-
56
-
57
-
58
-
59
-
 60
60 -
 61
61 -
 62
62 -
 63
63 -
 64
64 -
 65
65 -
 66
66 -
 67
67 -
 68
68 -
 69
69 -
 70
70 -
 71
71 -
 72
72 -
 73
73 -
 74
74 -
 75
75 -
 76
76 -
 77
77 -
 78
78 -
 79
79 -
 80
80 -
81
-
82
-
83
-
84
-
85
-
86
-
87
-
88
-
89
-
90
-
91
-
92
-
93
-
94
-
95
-
96
-
97
-
98
 |
 |

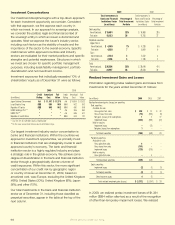
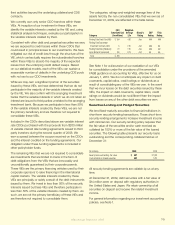
Investment Concentrations
Our investment discipline begins with a top-down approach
for each investment opportunity we consider. Consistent
with that approach, we rst approve each country in
which we invest. In our approach to sovereign analysis,
we consider the political, legal and nancial context of
the sovereign entity in which an issuer is domiciled and
operates. Next we approve the issuer’s industry sector,
including such factors as the stability of results and the
importance of the sector to the overall economy. Specic
credit names within approved countries and industry
sectors are evaluated for their market positions and specic
strengths and potential weaknesses. Structures in which
we invest are chosen for specic portfolio management
purposes, including asset/liability management, portfolio
diversication and net investment income.
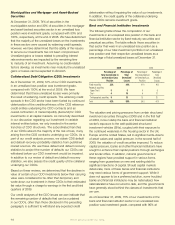
Investment exposures that individually exceeded 10% of
shareholders’ equity as of December 31 were as follows:
2009 2008
Credit Amortized Fair Credit Amortized Fair
(In millions) Rating Cost Value Rating Cost Value
Japan National Government AA $ 11,167 $ 11,375 AA $ 10,604 $ 11,533
Israel Electric Corp. BBB 889 869 BBB 902 902
Republic of Tunisia BBB 868 862 BBB 880 909
HSBC Holdings PLC ** * * * AA 856 860
HBOS PLC** * * * AA 686 611
Republic of South Africa * * * BBB 674 727
* Less than 10% of shareholders’ equity at reporting date
** For this issuer, we own more than one security with different ratings.
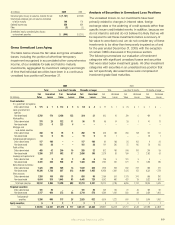
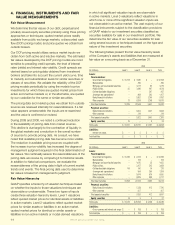
Our largest investment industry sector concentration is
banks and nancial institutions. Within the countries we
approve for investment opportunities, we primarily invest
in nancial institutions that are strategically crucial to each
approved country’s economy. The bank and nancial
institution sector is a highly regulated industry and plays
a strategic role in the global economy. We achieve some
degree of diversication in the bank and nancial institution
sector through a geographically diverse universe of
credit exposures. Within this sector, the more signicant
concentration of our credit risk by geographic region
or country of issuer at December 31, 2009, based on
amortized cost, was: Europe, excluding the United Kingdom
(48%); United States (20%); United Kingdom (8%); Japan
(9%); and other (15%).
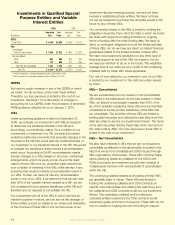
Our total investments in the bank and nancial institution
sector as of December 31, including those classied as
perpetual securities, appear in the table at the top of the
next column.
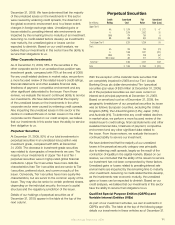
Realized Investment Gains and Losses
Information regarding pretax realized gains and losses from
investments for the years ended December 31 follows:
(In millions) 2009 2008 2007
Realized investment gains (losses) on securities:
Debt securities:
Available for sale:
Gross gains from sales $ 258 $ 10 $ 40
Gross losses from sales (18) (265) (6)
Net gains (losses) from redemptions 1 3 17
Impairment losses (630) (298) (22)
Held to maturity:
Impairment losses – (75) –
Net gains (losses) from redemptions 1 – –
Total debt securities (388) (625) 29
Perpetual securities:
Available for sale:
Gross gains from sales 4 – –
Gross losses from sales (101) – –
Impairment losses (729) (379) –
Held to maturity:
Gross gains from sales – 5 –
Total perpetual securities (826) (374) –
Equity securities:
Impairment losses (2) (1) (1)
Total equity securities (2) (1) (1)
Other long-term assets 4 (7) –
Total realized investment gains (losses) $ (1,212) $ (1,007) $ 28
In 2009, we realized pretax investment losses of $1,361
million ($884 million after-tax) as a result of the recognition
of other-than-temporary impairment losses. We realized
2009 2008
Total Investments in Total Investments in
Banks and Financial Percentage of Banks and Financial Percentage of
Institutions Sector Total Investment Institutions Sector Total Investment
(in millions) Portfolio (in millions) Portfolio
Debt securities:
Amortized cost $ 19,691 28% $ 19,868 28%
Fair value 18,023 26 17,793 27
Perpetual securities:
Upper Tier II:
Amortized cost $ 4,909 7% $ 6,238 9%
Fair value 4,938 7 5,960 9
Tier I:
Amortized cost 2,354 3 2,542 4
Fair value 2,006 3 1,780 3
Total:
Amortized cost $ 26,954 38% $ 28,648 41%
Fair value 24,967 36 25,533 39
We’ve got you under our wing.
66