Aflac 2009 Annual Report Download - page 32
Download and view the complete annual report
Please find page 32 of the 2009 Aflac annual report below. You can navigate through the pages in the report by either clicking on the pages listed below, or by using the keyword search tool below to find specific information within the annual report.-
 1
1 -
2
-
3
-
4
-
5
-
6
-
7
-
8
-
9
-
10
-
11
-
12
-
13
-
14
-
15
-
16
-
17
-
18
-
19
-
20
-
21
-
 22
22 -
 23
23 -
 24
24 -
 25
25 -
 26
26 -
 27
27 -
 28
28 -
 29
29 -
 30
30 -
 31
31 -
 32
32 -
 33
33 -
 34
34 -
 35
35 -
 36
36 -
 37
37 -
 38
38 -
 39
39 -
 40
40 -
 41
41 -
 42
42 -
43
-
44
-
45
-
46
-
47
-
48
-
49
-
50
-
51
-
52
-
53
-
54
-
55
-
56
-
57
-
58
-
59
-
60
-
61
-
62
-
63
-
64
-
65
-
66
-
67
-
68
-
69
-
70
-
71
-
72
-
73
-
74
-
75
-
76
-
77
-
78
-
79
-
80
-
81
-
82
-
83
-
84
-
85
-
86
-
87
-
88
-
89
-
90
-
91
-
92
-
93
-
94
-
95
-
96
-
97
-
98
 |
 |

authorities. The second step is measurement, whereby a
tax position that meets the more-likely-than-not recognition
threshold is measured to determine the amount of benet to
recognize in the nancial statements.
See Note 8 of the Notes to the Consolidated Financial
Statements for additional information.
New Accounting Pronouncements
During the last three years, various accounting standard-
setting bodies have been active in soliciting comments and
issuing statements, interpretations and exposure drafts.
For information on new accounting pronouncements and
the impact, if any, on our nancial position or results of
operations, see Note 1 of the Notes to the Consolidated
Financial Statements.
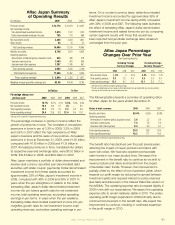
RESULTS OF OPERATIONS
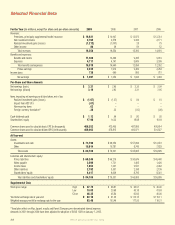
The following table is a presentation of items impacting net
earnings and net earnings per diluted share for the years
ended December 31.
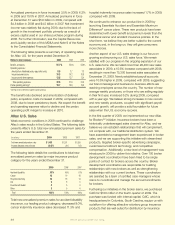
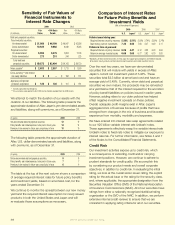
Realized Investment Gains and Losses
Our investment strategy is to invest in investment-grade
xed-income securities to provide a reliable stream of
investment income, which is one of the drivers of the
Company’s protability. This investment strategy aligns our
assets with our liability structure, which our assets support.
We do not purchase securities with the intent of generating
capital gains or losses. However, investment gains and
losses may be realized as a result of changes in the nancial
markets and the creditworthiness of specic issuers, tax
planning strategies, and/or general portfolio maintenance
and rebalancing. The realization of investment gains and
losses is independent of the underwriting and administration
of our insurance products, which are the principal drivers of
our protability.
In 2009, we realized pretax investment losses of $1,361
million ($884 million after-tax) as a result of the recognition
of other-than-temporary impairment losses. We realized
pretax investment losses of $101 million ($66 million after-
tax) from the exchange of two of our Lloyd’s Banking Group
plc perpetual security investments. We exchanged our
investment in Lloyds TSB Bank plc yen-denominated, Upper
Tier II perpetual securities into yen-denominated, Lower
Tier II xed-maturity securities. We also exchanged our
holdings of Bank of Scotland plc yen-denominated, Upper
Tier II perpetual securities into yen-denominated, Lower Tier
II xed-maturity securities. The losses were partially offset
by pretax investment gains of $250 million ($162 million
after-tax) that were generated primarily from a bond-swap
program that took advantage of tax loss carryforwards.
In 2008, we realized pretax investment losses of $753
million ($489 million after-tax) as a result of the recognition of
other-than-temporary impairment losses. We realized pretax
investment losses, net of gains, of $254 million ($166 million
after-tax) from securities sold or redeemed in the normal
course of business.
In 2007, we realized pretax investment losses of $23 million
($15 million after-tax) as a result of the recognition of other-
than-temporary impairment losses. We realized pretax
investment gains, net of losses, of $51 million ($34 million
after-tax) from securities sold or redeemed in the normal
course of business.
The following table details our pretax impairment losses by
category for the years ended December 31.
For additional information regarding realized investment
gains and losses, please see Notes 1, 3 and 4 of the Notes
to the Consolidated Financial Statements.
Impact from ASC 815 (formerly SFAS 133)
We had cross-currency interest rate swap agreements
that economically converted our dollar-denominated
senior notes, which matured in April 2009, into a yen-
denominated obligation. Until April 2009, we designated
the foreign currency component of these cross-currency
swaps as a hedge of the foreign currency exposure of our
investment in Aac Japan. The effect of issuing xed-rate,
dollar-denominated debt and swapping it into xed-rate,
yen-denominated debt had the same economic impact
on Aac as if we had issued yen-denominated debt of a
like amount. However, the accounting treatment for cross-
currency swaps is different from issuing yen-denominated
(In millions) 2009 2008 2007
Perpetual securities $ 729 $ 379 $ –
Corporate bonds 458 160 20
Collateralized debt obligations 148 213 –
Collateralized mortgage obligations 24 – 2
Equity securities 2
1
1
Total other-than-temporary impairments $ 1,361 $ 753 $ 23
Items Impacting Net Earnings
In Millions Per Diluted Share
2009 2008 2007 2009 2008 2007
Net earnings $1,497 $1,254 $1,634 $3.19 $2.62 $3.31
Items impacting net earnings, net of tax:
Realized investment gains (losses) (788) (655) 19 (1.67) (1.37) .04
Impact from ASC 815 (3) (3) 2 (.01) – –
Gain on extinguishment of debt 11 – – .02 – –
We’ve got you under our wing.
28