Aflac 2009 Annual Report Download - page 30
Download and view the complete annual report
Please find page 30 of the 2009 Aflac annual report below. You can navigate through the pages in the report by either clicking on the pages listed below, or by using the keyword search tool below to find specific information within the annual report.-
 1
1 -
2
-
3
-
4
-
5
-
6
-
7
-
8
-
9
-
10
-
11
-
12
-
13
-
14
-
15
-
16
-
17
-
18
-
19
-
 20
20 -
 21
21 -
 22
22 -
 23
23 -
 24
24 -
 25
25 -
 26
26 -
 27
27 -
 28
28 -
 29
29 -
 30
30 -
 31
31 -
 32
32 -
 33
33 -
 34
34 -
 35
35 -
 36
36 -
 37
37 -
 38
38 -
 39
39 -
 40
40 -
41
-
42
-
43
-
44
-
45
-
46
-
47
-
48
-
49
-
50
-
51
-
52
-
53
-
54
-
55
-
56
-
57
-
58
-
59
-
60
-
61
-
62
-
63
-
64
-
65
-
66
-
67
-
68
-
69
-
70
-
71
-
72
-
73
-
74
-
75
-
76
-
77
-
78
-
79
-
80
-
81
-
82
-
83
-
84
-
85
-
86
-
87
-
88
-
89
-
90
-
91
-
92
-
93
-
94
-
95
-
96
-
97
-
98
 |
 |

See Notes 1, 3 and 4 of the Notes to the
Consolidated Financial Statements for additional
information.
Deferred Policy Acquisition Costs and
Policy Liabilities
Aac’s products are generally long-duration xed-
benet indemnity contracts. We make estimates
of certain factors that affect the protability of
our business to match expected policy benets
and deferrable acquisition costs with expected
policy premiums. These assumptions include persistency,
morbidity, mortality, investment yields and expenses. If
actual results match the assumptions used in establishing
policy liabilities and the deferral and amortization of
acquisition costs, prots will emerge as a level percentage of
earned premiums. However, because actual results will vary
from the assumptions, prots as a percentage of earned
premiums will vary from year to year.
We measure the adequacy of our policy reserves and
recoverability of deferred policy acquisition costs (DAC)
annually by performing gross premium valuations on our
business. Our testing indicates that our insurance liabilities
are adequate and that our DAC is recoverable.
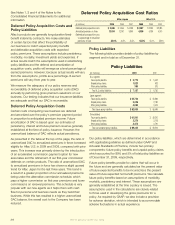
Deferred Policy Acquisition Costs
Certain costs of acquiring new business are deferred
and amortized over the policy’s premium payment period
in proportion to anticipated premium income. Future
amortization of DAC is based upon our estimates of
persistency, interest and future premium revenue generally
established at the time of policy issuance. However, the
unamortized balance of DAC reects actual persistency.
As presented in the table at the top of the page, the ratio of
unamortized DAC to annualized premiums in force increased
slightly for Aac U.S. in 2009 and 2008, compared with prior
years. This increase was primarily driven by the introduction
of an accelerated commission payment option for new
associates and the renement of our rst-year commission
deferrals on certain products. The ratio of unamortized DAC
to annualized premiums in force has shown a slight upward
trend for Aac Japan for the last three years. This trend is
a result of a greater proportion of our annualized premiums
being under the alternative commission schedule, which
pays a higher commission on rst-year premiums and lower
commissions on renewal premiums. This schedule is very
popular with our new agents as it helps them with cash
ow for personal and business needs as they build their
business. While this has resulted in a higher unamortized
DAC balance, the overall cost to the Company has been
reduced.
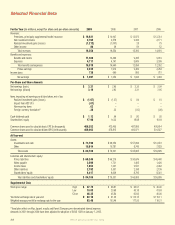
Policy Liabilities
The following table provides details of policy liabilities by
segment and in total as of December 31.
Our policy liabilities, which are determined in accordance
with applicable guidelines as dened under GAAP and
Actuarial Standards of Practice, include two primary
components: future policy benets and unpaid policy claims,
which accounted for 89% and 5% of total policy liabilities as
of December 31, 2009, respectively.
Future policy benets provide for claims that will occur in
the future and are generally calculated as the present value
of future expected benets to be incurred less the present
value of future expected net benet premiums. We calculate
future policy benets based on assumptions of morbidity,
mortality, persistency and interest. These assumptions are
generally established at the time a policy is issued. The
assumptions used in the calculations are closely related
to those used in developing the gross premiums for a
policy. As required by GAAP, we also include a provision
for adverse deviation, which is intended to accommodate
adverse uctuations in actual experience.
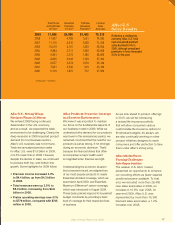
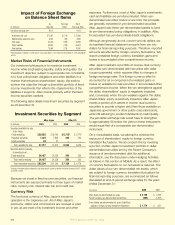
Deferred Policy Acquisition Cost Ratios
Aflac Japan Aflac U.S.
(In millions) 2009 2008 2007 2009 2008 2007
Deferred policy acquisition costs $ 5,846 $ 5,644 $ 4,269 $ 2,687 $ 2,593 $ 2,385
Annualized premiums in force 13,034 12,761 9,860 4,956 4,789 4,510
Deferred policy acquisition costs
as a percentage of annualized
premiums in force 44.9% 44.2% 43.3% 54.2% 54.1% 52.9%
Policy Liabilities
(In millions)
2009
2008
U.S. segment:
Future policy benefits $ 5,779 $ 5,442
Unpaid policy claims 1,023 933
Other policy liabilities 385 375
Total U.S. policy liabilities $ 7,187 $ 6,750
Japan segment:
Future policy benefits $ 55,720 $ 53,866
Unpaid policy claims 2,246 2,184
Other policy liabilities 4,089 3,416
Total Japan policy liabilities $ 62,055 $ 59,466
Consolidated:
Future policy benefits $ 61,501 $ 59,310
Unpaid policy claims 3,270 3,118
Other policy liabilities 4,474 3,791
Total consolidated policy liabilities $ 69,245 $ 66,219
We’ve got you under our wing.
26