Aflac 2009 Annual Report Download - page 73
Download and view the complete annual report
Please find page 73 of the 2009 Aflac annual report below. You can navigate through the pages in the report by either clicking on the pages listed below, or by using the keyword search tool below to find specific information within the annual report.-
 1
1 -
2
-
3
-
4
-
5
-
6
-
7
-
8
-
9
-
10
-
11
-
12
-
13
-
14
-
15
-
16
-
17
-
18
-
19
-
20
-
21
-
22
-
23
-
24
-
25
-
26
-
27
-
28
-
29
-
30
-
31
-
32
-
33
-
34
-
35
-
36
-
37
-
38
-
39
-
40
-
41
-
42
-
43
-
44
-
45
-
46
-
47
-
48
-
49
-
50
-
51
-
52
-
53
-
54
-
55
-
56
-
57
-
58
-
59
-
60
-
61
-
62
-
 63
63 -
 64
64 -
 65
65 -
 66
66 -
 67
67 -
 68
68 -
 69
69 -
 70
70 -
 71
71 -
 72
72 -
 73
73 -
 74
74 -
 75
75 -
 76
76 -
 77
77 -
 78
78 -
 79
79 -
 80
80 -
 81
81 -
 82
82 -
 83
83 -
84
-
85
-
86
-
87
-
88
-
89
-
90
-
91
-
92
-
93
-
94
-
95
-
96
-
97
-
98
 |
 |

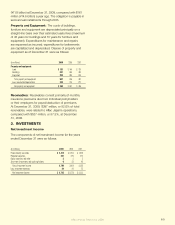
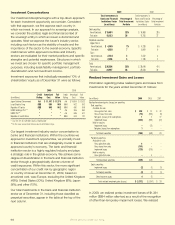
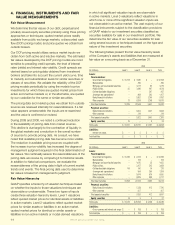
(In millions) 2009 2008
Unrealized gains (losses) on securities available for sale $ (1,141) $ (2,046)
Unamortized unrealized gains on securities transferred
to held to maturity 148 179
Deferred income taxes 356 659
Other (3) (3)
Shareholders’ equity, unrealized gains (losses)
on investment securities $ (640) $ (1,211)
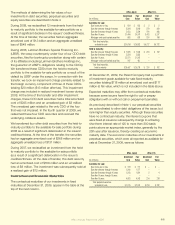
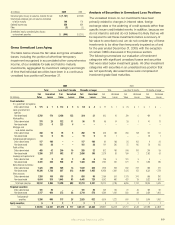
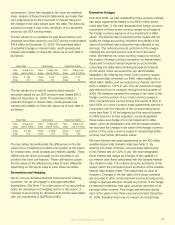
Gross Unrealized Loss Aging
The table below shows the fair value and gross unrealized
losses, including the portion of other-than-temporary
impairment recognized in accumulated other comprehensive
income, of our available-for-sale and held-to-maturity
investments, aggregated by investment category and length
of time that individual securities have been in a continuous
unrealized loss position at December 31.
Analysis of Securities in Unrealized Loss Positions
The unrealized losses on our investments have been
primarily related to changes in interest rates, foreign
exchange rates or the widening of credit spreads rather than
specic issuer credit-related events. In addition, because we
do not intend to sell and do not believe it is likely that we will
be required to sell these investments before a recovery of
fair value to amortized cost, we do not consider any of these
investments to be other-than-temporarily impaired as of and
for the year ended December 31, 2009, with the exception
of certain CMOs discussed in the previous section.
The following summarizes our evaluation of investment
categories with signicant unrealized losses and securities
that were rated below investment grade. All other investment
categories with securities in an unrealized loss position that
are not specically discussed below were comprised of
investment grade xed maturities.
2009 2008
Total Less than 12 months 12 months or longer Total Less than 12 months 12 months or longer
Fair Unrealized Fair Unrealized Fair Unrealized Fair Unrealized Fair Unrealized Fair Unrealized
(In millions) Value Losses Value Losses Value Losses Value Losses Value Losses Value Losses
Fixed maturities:
U.S. government and agencies:
Dollar-denominated $ 175 $ 7 $ 112 $ 3 $ 63 $ 4 $ 77 $ 1 $ 76 $ 1 $ 1 $ –
Japan government and
agencies:
Yen-denominated 5,760 174 5,456 153 304 21 803 16 309 5 494 11
Municipalities:
Dollar-denominated 378 28 322 11 56 17 69 14 28 1 41 13
Yen-denominated 223 4 223 4 – – – – – – – –
Mortgage- and
asset-backed securities:
Dollar-denominated 338 78 78 3 260 75 406 189 284 138 122 51
Yen-denominated 54 6 35 – 19 6 26 1 – – 26 1
Collateralized debt obligations:
Dollar-denominated 117 100 – – 117 100 60 188 56 162 4 26
Yen-denominated 181 38 – – 181 38 101 295 75 145 26 150
Public utilities:
Dollar-denominated 465 42 200 10 265 32 812 165 566 106 246 59
Yen-denominated 3,290 217 592 37 2,698 180 2,376 83 184 2 2,192 81
Sovereign and supranational:
Dollar-denominated 92 9 43 3 49 6 106 9 101 9 5 –
Yen-denominated 2,331 239 948 31 1,383 208 1,780 257 571 71 1,209 186
Banks/financial institutions:
Dollar-denominated 1,325 259 305 14 1,020 245 1,528 529 830 212 698 317
Yen-denominated 10,306 1,768 807 313 9,499 1,455 10,458 1,881 2,128 152 8,330 1,729
Other corporate:
Dollar-denominated 1,393 108 535 13 858 95 2,166 501 1,178 241 988 260
Yen-denominated 6,084 818 1,643 93 4,441 725 4,342 660 420 29 3,922 631
Total fixed maturities 32,512 3,895 11,299 688 21,213 3,207 25,110 4,789 6,806 1,274 18,304 3,515
Perpetual securities:
Dollar-denominated 181 56 – – 181 56 235 136 70 46 165 90
Yen-denominated 3,117 604 373 28 2,744 576 4,284 1,091 830 89 3,454 1,002
Total perpetual
securities 3,298 660 373 28 2,925 632 4,519 1,227 900 135 3,619 1,092
Equity securities 6 2 3 1 3 1 8 2 5 1 3 1
Total $ 35,816 $ 4,557 $ 11,675 $ 717 $ 24,141 $ 3,840 $ 29,637 $ 6,018 $ 7,711 $ 1,410 $ 21,926 $ 4,608
Aflac Annual Report for 2009 69