Aflac 2009 Annual Report Download - page 57
Download and view the complete annual report
Please find page 57 of the 2009 Aflac annual report below. You can navigate through the pages in the report by either clicking on the pages listed below, or by using the keyword search tool below to find specific information within the annual report.-
 1
1 -
2
-
3
-
4
-
5
-
6
-
7
-
8
-
9
-
10
-
11
-
12
-
13
-
14
-
15
-
16
-
17
-
18
-
19
-
20
-
21
-
22
-
23
-
24
-
25
-
26
-
27
-
28
-
29
-
30
-
31
-
32
-
33
-
34
-
35
-
36
-
37
-
38
-
39
-
40
-
41
-
42
-
43
-
44
-
45
-
46
-
 47
47 -
 48
48 -
 49
49 -
 50
50 -
 51
51 -
 52
52 -
 53
53 -
 54
54 -
 55
55 -
 56
56 -
 57
57 -
 58
58 -
 59
59 -
 60
60 -
 61
61 -
 62
62 -
 63
63 -
 64
64 -
 65
65 -
 66
66 -
 67
67 -
68
-
69
-
70
-
71
-
72
-
73
-
74
-
75
-
76
-
77
-
78
-
79
-
80
-
81
-
82
-
83
-
84
-
85
-
86
-
87
-
88
-
89
-
90
-
91
-
92
-
93
-
94
-
95
-
96
-
97
-
98
 |
 |

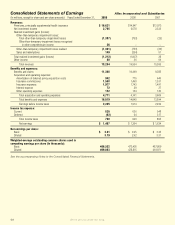
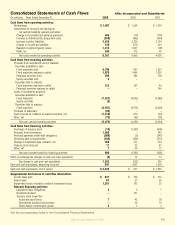
Consolidated Statements of Cash Flows Aac Incorporated and Subsidiaries
(In millions) Years Ended December 31, 2009 2008 2007
Cash flows from operating activities:
Net earnings $ 1,497 $ 1,254 $ 1,634
Adjustments to reconcile net earnings to
net cash provided by operating activities:
Change in receivables and advance premiums 406 (10) (176)
Increase in deferred policy acquisition costs (358) (462) (454)
Increase in policy liabilities 3,019 3,235 3,194
Change in income tax liabilities 139 (271) 421
Realized investment (gains) losses 1,212 1,007 (28)
Other, net 246 212 65
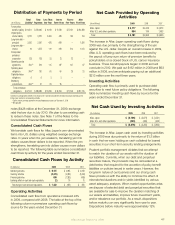
Net cash provided by operating activities 6,161 4,965 4,656
Cash flows from investing activities:
Proceeds from investments sold or matured:
Securities available for sale:
Fixed maturities sold 4,798 897 1,261
Fixed maturities matured or called 1,976 1,496 1,552
Perpetual securities sold 595 484 194
Equity securities sold 2 – –
Securities held to maturity:
Fixed maturities matured or called 212 247 45
Perpetual securities matured or called – – 140
Costs of investments acquired:
Securities available for sale:
Fixed maturities (7,521) (4,042) (3,848)
Equity securities (2) – –
Securities held to maturity:
Fixed maturities (4,167) (3,973) (2,920)
Purchase of subsidiary (83) – –
Cash received as collateral on loaned securities, net (1,214) 670 (23)
Other, net (72) (62) (55)
Net cash used by investing activities (5,476) (4,283) (3,654)
Cash flows from financing activities:
Purchases of treasury stock (10) (1,490) (606)
Proceeds from borrowings 1,405 – 242
Principal payments under debt obligations (560) (5) (247)
Dividends paid to shareholders (524) (434) (373)
Change in investment-type contracts, net 364 471 210
Treasury stock reissued 17 32 47
Other, net 7 43 72
Net cash provided (used) by financing activities 699 (1,383) (655)
Effect of exchange rate changes on cash and cash equivalents (2) 79 13
Net change in cash and cash equivalents 1,382 (622) 360
Cash and cash equivalents, beginning of period 941 1,563 1,203
Cash and cash equivalents, end of period $ 2,323 $ 941 $ 1,563
Supplemental disclosures of cash flow information:
Income taxes paid $ 627 $ 765 $ 416
Interest paid 61 27 26
Impairment losses included in realized investment losses 1,361 753 23
Noncash financing activities:
Capitalized lease obligations 2 3 1
Dividends declared – 131 –
Treasury stock issued for:
Associate stock bonus 7 43 38
Shareholder dividend reinvestment – 20 19
Share-based compensation grants 4 2 2
See the accompanying Notes to the Consolidated Financial Statements.
Aflac Annual Report for 2009 53