Aflac 2009 Annual Report Download - page 45
Download and view the complete annual report
Please find page 45 of the 2009 Aflac annual report below. You can navigate through the pages in the report by either clicking on the pages listed below, or by using the keyword search tool below to find specific information within the annual report.-
 1
1 -
2
-
3
-
4
-
5
-
6
-
7
-
8
-
9
-
10
-
11
-
12
-
13
-
14
-
15
-
16
-
17
-
18
-
19
-
20
-
21
-
22
-
23
-
24
-
25
-
26
-
27
-
28
-
29
-
30
-
31
-
32
-
33
-
34
-
 35
35 -
 36
36 -
 37
37 -
 38
38 -
 39
39 -
 40
40 -
 41
41 -
 42
42 -
 43
43 -
 44
44 -
 45
45 -
 46
46 -
 47
47 -
 48
48 -
 49
49 -
 50
50 -
 51
51 -
 52
52 -
 53
53 -
 54
54 -
 55
55 -
56
-
57
-
58
-
59
-
60
-
61
-
62
-
63
-
64
-
65
-
66
-
67
-
68
-
69
-
70
-
71
-
72
-
73
-
74
-
75
-
76
-
77
-
78
-
79
-
80
-
81
-
82
-
83
-
84
-
85
-
86
-
87
-
88
-
89
-
90
-
91
-
92
-
93
-
94
-
95
-
96
-
97
-
98
 |
 |

As previously disclosed, we own long-dated debt
instruments in support of our long-dated policyholder
obligations. Included in our largest global investment
holdings are legacy issues that date back many years.
Additionally, the concentration of certain of our holdings of
individual credit exposures has grown over time through
merger and consolidation activity. Beginning in 2005, we
have, as a general rule, limited our investment exposures
to issuers to no more than 5% of total adjusted capital
(TAC) on a statutory accounting basis, with the exception of
obligations of the Japan and U.S. governments. However,
existing investment exposures that exceeded 5% of TAC
at the time this rule was adopted or exposures that may
exceed this threshold from time to time through merger and
consolidation activity are not automatically reduced through
sales of the issuers’ securities but rather are reduced over
time consistent with our investment policy.
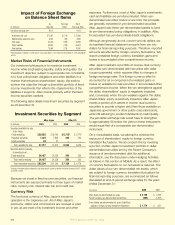
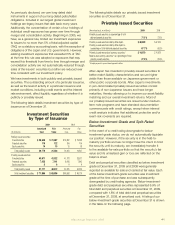
We have investments in both publicly and privately issued
securities. The outstanding amount of a particular issuance,
as well as the level of activity in a particular issuance and
market conditions, including credit events and the interest
rate environment, affect liquidity regardless of whether it is
publicly or privately issued.
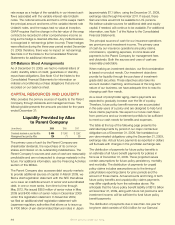
The following table details investment securities by type of
issuance as of December 31.
The following table details our privately issued investment
securities as of December 31.
Aac Japan has invested in privately issued securities to
better match liability characteristics and secure higher
yields than those available on Japanese government or
other public corporate bonds. Aac Japan’s investments
in yen-denominated privately issued securities consist
primarily of non-Japanese issuers and have longer
maturities, thereby allowing us to improve our asset/liability
matching and our overall investment returns. Most of
our privately issued securities are issued under medium-
term note programs and have standard documentation
commensurate with credit ratings, except when internal
credit analysis indicates that additional protective and/or
event-risk covenants are required.
Below-Investment-Grade and Split-Rated
Securities
In the event of a credit rating downgrade to below-
investment-grade status, we do not automatically liquidate
our position. However, if the security is in the held-to-
maturity portfolio and we no longer have the intent to hold
the security until its maturity, we immediately transfer it
to the available-for-sale portfolio so that the security’s fair
value and its unrealized gain or loss are reected on the
balance sheet.
Debt and perpetual securities classied as below investment
grade at December 31, 2009 and 2008 were generally
reported as available for sale and carried at fair value. Each
of the below-investment-grade securities was investment
grade at the time of purchase and was subsequently
downgraded by credit rating agencies. Below-investment-
grade debt and perpetual securities represented 6.9% of
total debt and perpetual securities at December 31, 2009,
compared with 1.8% of total debt and perpetual securities
at December 31, 2008, at amortized cost. A listing of our
below-investment-grade securities at December 31 is shown
in the table on the following page.
Investment Securities
by Type of Issuance
2009 2008
Amortized Fair Amortized Fair
(In millions) Cost Value Cost Value
Publicly issued securities:
Fixed maturities $ 20,649 $ 21,087 $ 19,292 $ 19,525
Perpetual securities 116 122 156 104
Equity securities 14 15 15 18
Total publicly issued 20,779 21,224 19,463 19,647
Privately issued securities:
Fixed maturities 43,671 41,522 41,178 38,571
Perpetual securities 7,438 7,141 8,918 7,943
Equity securities 8 9 9 9
Total privately issued 51,117 48,672 50,105 46,523
Total investment securities $ 71,896 $ 69,896 $ 69,568 $ 66,170
Privately Issued Securities
(Amortized cost, in millions) 2009
2008
Privately issued securities as a percentage of total
debt and perpetual securities 71.1% 72.0%
Privately issued securities held by Aflac Japan $ 48,639 $ 47,516
Privately issued securities held by Aflac Japan as
a percentage of total debt and perpetual securities 67.7% 68.3%
Privately issued reverse-dual currency securities* $ 14,070 $ 14,678
Reverse-dual currency securities* as a percentage of total
privately issued securities 27.5% 29.3%
* Principal payments in yen and interest payment in dollars
Aflac Annual Report for 2009 41