Aflac 2009 Annual Report Download - page 91
Download and view the complete annual report
Please find page 91 of the 2009 Aflac annual report below. You can navigate through the pages in the report by either clicking on the pages listed below, or by using the keyword search tool below to find specific information within the annual report.-
 1
1 -
2
-
3
-
4
-
5
-
6
-
7
-
8
-
9
-
10
-
11
-
12
-
13
-
14
-
15
-
16
-
17
-
18
-
19
-
20
-
21
-
22
-
23
-
24
-
25
-
26
-
27
-
28
-
29
-
30
-
31
-
32
-
33
-
34
-
35
-
36
-
37
-
38
-
39
-
40
-
41
-
42
-
43
-
44
-
45
-
46
-
47
-
48
-
49
-
50
-
51
-
52
-
53
-
54
-
55
-
56
-
57
-
58
-
59
-
60
-
61
-
62
-
63
-
64
-
65
-
66
-
67
-
68
-
69
-
70
-
71
-
72
-
73
-
74
-
75
-
76
-
77
-
78
-
79
-
80
-
 81
81 -
 82
82 -
 83
83 -
 84
84 -
 85
85 -
 86
86 -
 87
87 -
 88
88 -
 89
89 -
 90
90 -
 91
91 -
 92
92 -
 93
93 -
 94
94 -
 95
95 -
 96
96 -
 97
97 -
 98
98
 |
 |

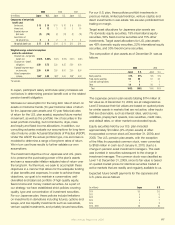
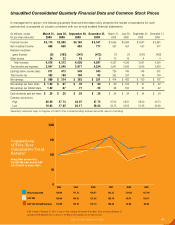
2009 2008 2007
(In millions) Japan U.S. Japan U.S. Japan U.S.
Components of net periodic
benefit cost:
Service cost $ 13 $ 10 $ 11 $ 10 $ 9 $ 10
Interest cost 4 12 3 11 3 10
Expected return on
plan assets (3) (12) (2) (12) (2) (10)
Amortization of
net actuarial loss 3 4 2 2 1 4
Net periodic benefit cost $ 17 $ 14 $ 14 $ 11 $ 11 $ 14
Weighted-average actuarial assumptions
used in the calculations:
Discount rate – net periodic
benefit cost 2.50% 6.25% 2.50% 6.00% 2.50% 5.50%
Discount rate – benefit
obligations 2.50 5.75 2.50 6.25 2.50 6.00
Expected long-term return
on plan assets 2.50 8.00 2.50 8.00 2.50 8.00
Rate of compensation
increase N/A* 4.00 N/A* 4.00 N/A* 4.00
*Not applicable
In Japan, participant salary and future salary increases are
not factors in determining pension benet cost or the related
pension benet obligation.
We base our assumption for the long-term rate of return on
assets on historical trends (10-year historical rates of return
for the Japanese plan assets and 15-year historical rates
of return for the U.S. plan assets), expected future market
movement, as well as the portfolio mix of securities in the
asset portfolio including, but not limited to, style, class
and equity and xed income allocations. In addition, our
consulting actuaries evaluate our assumptions for long-term
rate of returns under Actuarial Standards of Practice (ASOP).
Under the ASOP, the actual portfolio type, mix and class is
modeled to determine a range of long-term rates of return.
We in turn use those results to further validate our own
assumptions.
The investment objective of our Japanese and U.S. plans
is to preserve the purchasing power of the plan’s assets
and earn a reasonable ination-adjusted rate of return over
the long term. Furthermore, we seek to accomplish these
objectives in a manner that allows for the adequate funding
of plan benets and expenses. In order to achieve these
objectives, our goal is to maintain a conservative, well-
diversied and balanced portfolio of high-quality equity,
xed-income and money market securities. As a part of
our strategy, we have established strict policies covering
quality, type and concentration of investment securities.
For our Japanese plan, these policies include limitations
on investments in derivatives including futures, options and
swaps, and low-liquidity investments such as real estate,
venture capital investments, and privately issued securities.
For our U.S. plan, these policies prohibit investments in
precious metals, limited partnerships, venture capital, and
direct investments in real estate. We are also prohibited from
trading on margin.
Target asset allocations for Japanese plan assets are
7% domestic equity securities, 19% international equity
securities, 59% xed-income securities and 15% other
investments. Target asset allocations for U.S. plan assets
are 43% domestic equity securities, 22% international equity
securities, and 35% xed-income securities.
The composition of plan assets as of December 31 was as
follows:
2009 2008
Japan U.S. Japan U.S.
Equity securities 31% 67% 30% 61%
Fixed-income securities 55 28 54 34
Cash and cash equivalents – 1 – 1
Other 14 4 16 4
Total 100% 100% 100% 100%
The Japanese pension plan assets totaling $114 million at
fair value as of December 31, 2009, are all categorized as
Level 2 because their fair values are based on quoted prices
for similar assets in markets that are not active, other inputs
that are observable, such as interest rates, yield curves,
volatilities, prepayment speeds, loss severities, credit risks,
and default rates, or other market-corroborated inputs.
Equity securities held by our U.S. plan included
approximately $3 million (2% of plan assets) of Aac
Incorporated common stock at December 31, 2009, and
2008. The U.S. pension plan assets, with the exception
of the Aac Incorporated common stock, were converted
to $168 million in cash as of January 6, 2010, due to a
change in pension asset investment managers. The cash
was invested in securities subsequent to the change in
investment manager. The common stock was classied as
Level 1 at December 31, 2009, since its fair value is based
on quoted market prices for identical securities traded in
active markets that are readily and regularly available to us.
Expected future benet payments for the Japanese and
U.S. plans are as follows:
(In millions) Japan U.S.
2010 $ 5 $ 5
2011 5 5
2012 5 6
2013 6 7
2014 7 8
2015 - 2019 38 53
Aflac Annual Report for 2009 87