Aflac 2009 Annual Report Download - page 67
Download and view the complete annual report
Please find page 67 of the 2009 Aflac annual report below. You can navigate through the pages in the report by either clicking on the pages listed below, or by using the keyword search tool below to find specific information within the annual report.-
 1
1 -
2
-
3
-
4
-
5
-
6
-
7
-
8
-
9
-
10
-
11
-
12
-
13
-
14
-
15
-
16
-
17
-
18
-
19
-
20
-
21
-
22
-
23
-
24
-
25
-
26
-
27
-
28
-
29
-
30
-
31
-
32
-
33
-
34
-
35
-
36
-
37
-
38
-
39
-
40
-
41
-
42
-
43
-
44
-
45
-
46
-
47
-
48
-
49
-
50
-
51
-
52
-
53
-
54
-
55
-
56
-
 57
57 -
 58
58 -
 59
59 -
 60
60 -
 61
61 -
 62
62 -
 63
63 -
 64
64 -
 65
65 -
 66
66 -
 67
67 -
 68
68 -
 69
69 -
 70
70 -
 71
71 -
 72
72 -
 73
73 -
 74
74 -
 75
75 -
 76
76 -
 77
77 -
78
-
79
-
80
-
81
-
82
-
83
-
84
-
85
-
86
-
87
-
88
-
89
-
90
-
91
-
92
-
93
-
94
-
95
-
96
-
97
-
98
 |
 |

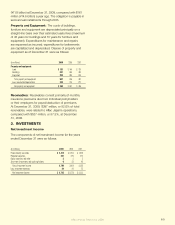
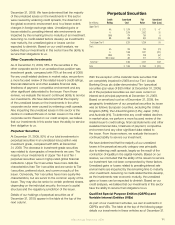
(¥11.8 billion) at December 31, 2009, compared with $161
million (¥14.6 billion) a year ago. The obligation is payable in
semi-annual installments through 2013.
Property and Equipment: The costs of buildings,
furniture and equipment are depreciated principally on a
straight-line basis over their estimated useful lives (maximum
of 45 years for buildings and 10 years for furniture and
equipment). Expenditures for maintenance and repairs
are expensed as incurred; expenditures for betterments
are capitalized and depreciated. Classes of property and
equipment as of December 31 were as follows:
(In millions) 2009 2008 2007
Property and equipment:
Land $ 153 $ 146 $ 120
Buildings 501 505 403
Equipment 293 265 244
Total property and equipment 947 916 767
Less accumulated depreciation 354 319 271
Net property and equipment $ 593 $ 597 $ 496
Receivables: Receivables consist primarily of monthly
insurance premiums due from individual policyholders
or their employers for payroll deduction of premiums.
At December 31, 2009, $397 million, or 52.0% of total
receivables, were related to Aac Japan’s operations,
compared with $527 million, or 57.3%, at December
31, 2008.
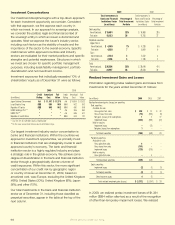
3. INVESTMENTS
Net Investment Income
The components of net investment income for the years
ended December 31 were as follows:
(In millions) 2009 2008 2007
Fixed-maturity securities $ 2,413 $ 2,204 $ 1,936
Perpetual securities 367 375 372
Equity securities and other 3 3 2
Short-term investments and cash equivalents 6 22 45
Gross investment income 2,789 2,604 2,355
Less investment expenses 24 26 22
Net investment income $ 2,765 $ 2,578 $ 2,333
Aflac Annual Report for 2009 63