Aflac 2009 Annual Report Download - page 79
Download and view the complete annual report
Please find page 79 of the 2009 Aflac annual report below. You can navigate through the pages in the report by either clicking on the pages listed below, or by using the keyword search tool below to find specific information within the annual report.-
 1
1 -
2
-
3
-
4
-
5
-
6
-
7
-
8
-
9
-
10
-
11
-
12
-
13
-
14
-
15
-
16
-
17
-
18
-
19
-
20
-
21
-
22
-
23
-
24
-
25
-
26
-
27
-
28
-
29
-
30
-
31
-
32
-
33
-
34
-
35
-
36
-
37
-
38
-
39
-
40
-
41
-
42
-
43
-
44
-
45
-
46
-
47
-
48
-
49
-
50
-
51
-
52
-
53
-
54
-
55
-
56
-
57
-
58
-
59
-
60
-
61
-
62
-
63
-
64
-
65
-
66
-
67
-
68
-
 69
69 -
 70
70 -
 71
71 -
 72
72 -
 73
73 -
 74
74 -
 75
75 -
 76
76 -
 77
77 -
 78
78 -
 79
79 -
 80
80 -
 81
81 -
 82
82 -
 83
83 -
 84
84 -
 85
85 -
 86
86 -
 87
87 -
 88
88 -
 89
89 -
90
-
91
-
92
-
93
-
94
-
95
-
96
-
97
-
98
 |
 |

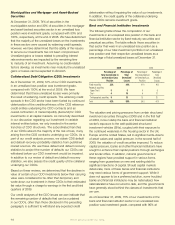
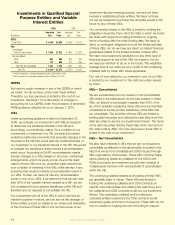
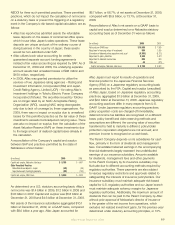
Approximately 42% of our investments classied as Level
2 are valued by obtaining quoted market prices from our
investment custodian. The custodian obtains price quotes
from various pricing services that estimate fair values based
on observable market transactions for similar investments
in active markets, market transactions for the same
investments in inactive markets or other observable market
data where available.
The fair value of approximately 51% of our Level 2
investments is determined using our DCF pricing model. The
signicant valuation inputs to the DCF model are obtained
from, or corroborated by, observable market sources from
both active and inactive markets.
For the remaining Level 2 investments that are not quoted
by our custodian and cannot be priced under the DCF
pricing model, we obtain specic broker quotes from up
to three outside securities brokers and generally use the
average of the quotes to estimate the fair value of the
securities.
Historically, we have not adjusted the quotes or prices we
obtain from the brokers and pricing services we use.
The fair value of our swap contracts is based on the amount
we would expect to receive or pay to terminate the swaps.
The prices used to determine the value of the swaps are
obtained from the respective swap counterparties and take
into account current interest rates, duration, counterparty
credit risk and our own credit rating.
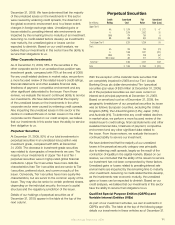
The xed maturities and perpetual securities classied as
Level 3 consist of securities for which there are limited or
no observable valuation inputs. We estimate the fair value
of these securities by obtaining broker quotes from a limited
number of brokers. These brokers base their quotes on
a combination of their knowledge of the current pricing
environment and market ows. We consider these inputs
unobservable. The equity securities classied in Level 3
are related to investments in Japanese businesses, each of
which are insignicant and in the aggregate are immaterial.
Because fair values for these investments are not readily
available, we carry them at their original cost. We review
each of these investments periodically and, in the event we
determine that any are other-than-temporarily impaired, we
write them down to their estimated fair value at that time.
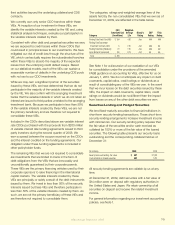
Level 3 Rollforward
The tables to the right present the changes in our available-
for-sale securities classied as Level 3 for the years ended
December 31.
2009
Unrealized
Realized Gains or
Gains or Losses Transfers Change in
Losses Included in Into Unrealized
Balance, Included Other Purchases and/or Balance, Gains
Beginning in Comprehensive and Out of End of (Losses)
(In millions) of Period Earnings Income Settlements Level 3 Period Still Held*
Fixed maturities:
Mortgage- and
asset-backed
securities $ 35 $ – $ (1) $ 31 $ (3) $ 62 $ –
Public utilities 502 – (14) – 9 497 –
Collateralized
debt obligations 19 (140) 275 (14) 127 267 (148)
Sovereign and
supranational 260 – 33 – – 293 –
Banks/financial
institutions 876 (75) 194 (243) 488 1,240 –
Other corporate 898 – 150 – 200 1,248 –
Total fixed
maturities 2,590 (215) 637 (226) 821 3,607 (148)
Perpetual
securities:
Banks/financial
institutions 412 (426) 510 – 945 1,441 (427)
Total perpetual
securities 412 (426) 510 – 945 1,441 (427)
Equity securities 4 – (1) – 6 9 –
Total $ 3,006 $ (641) $ 1,146 $ (226) $ 1,772 $ 5,057 $ (575)
* Represents the amount of total gains or losses for the period, included in earnings, attributable to the change in unrealized
gains (losses) relating to assets classified as Level 3 that were still held at December 31, 2009.
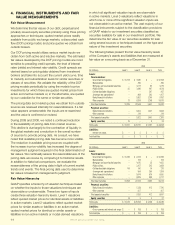
2008
Unrealized
Realized Gains or
Gains or Losses Transfers Change in
Losses Included in Into Unrealized
Balance, Included Other Purchases and/or Balance, Gains
Beginning in Comprehensive and Out of End of (Losses)
(In millions) of Period Earnings Income Settlements Level 3 Period Still Held*
Fixed maturities:
Mortgage- and
asset-backed
securities $ 13 $ 1 $ 1 $ – $ 20 $ 35 $ –
Public utilities – – (24) – 526 502 –
Collateralized
debt obligations 76 (56) (10) 6 3 19 (37)
Sovereign and
supranational – – – – 260 260 –
Banks/financial
institutions 20 (2) (2) 40 820 876 (2)
Other corporate – – (11) – 909 898 –
Total fixed
maturities 109 (57) (46) 46 2,538 2,590 (39)
Perpetual
securities:
Banks/financial
institutions – – – – 412 412 –
Total perpetual
securities – – – – 412 412 –
Equity securities 3 – 1 – – 4 –
Total $ 112 $ (57) $ (45) $ 46 $ 2,950 $ 3,006 $ (39)
* Represents the amount of total gains or losses for the period, included in earnings, attributable to the change in unrealized
gains (losses) relating to assets classified as Level 3 that were still held at December 31, 2008.
Aflac Annual Report for 2009 75