Aflac 2009 Annual Report Download - page 38
Download and view the complete annual report
Please find page 38 of the 2009 Aflac annual report below. You can navigate through the pages in the report by either clicking on the pages listed below, or by using the keyword search tool below to find specific information within the annual report.-
 1
1 -
2
-
3
-
4
-
5
-
6
-
7
-
8
-
9
-
10
-
11
-
12
-
13
-
14
-
15
-
16
-
17
-
18
-
19
-
20
-
21
-
22
-
23
-
24
-
25
-
26
-
27
-
 28
28 -
 29
29 -
 30
30 -
 31
31 -
 32
32 -
 33
33 -
 34
34 -
 35
35 -
 36
36 -
 37
37 -
 38
38 -
 39
39 -
 40
40 -
 41
41 -
 42
42 -
 43
43 -
 44
44 -
 45
45 -
 46
46 -
 47
47 -
 48
48 -
49
-
50
-
51
-
52
-
53
-
54
-
55
-
56
-
57
-
58
-
59
-
60
-
61
-
62
-
63
-
64
-
65
-
66
-
67
-
68
-
69
-
70
-
71
-
72
-
73
-
74
-
75
-
76
-
77
-
78
-
79
-
80
-
81
-
82
-
83
-
84
-
85
-
86
-
87
-
88
-
89
-
90
-
91
-
92
-
93
-
94
-
95
-
96
-
97
-
98
 |
 |

Annualized premiums in force increased 3.5% in 2009, 6.2%
in 2008 and 10.0% in 2007. Annualized premiums in force
at December 31 were $5.0 billion in 2009, compared with
$4.8 billion in 2008 and $4.5 billion in 2007. Net investment
income was relatively at during 2009, due to the lack of
growth in the investment portfolio primarily as a result of
excess capital used in our share purchase program during
2008. For further information, see the Capital Resources
and Liquidity section of this MD&A and Note 9 of the Notes
to the Consolidated Financial Statements.
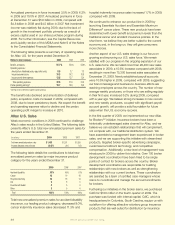
The following table presents a summary of operating ratios
for Aac U.S. for the years ended December 31.
The benet ratio declined and amortization of deferred
policy acquisition costs increased in 2009, compared with
2008, due to lower persistency levels. We expect the benet
and operating expense ratios to decline and the pretax
operating prot margin to increase in 2010.
Aflac U.S. Sales
Weak economic conditions in 2009 continued to challenge
Aac’s sales results in the United States. The following table
presents Aac’s U.S. total new annualized premium sales for
the years ended December 31.
The following table details the contributions to total new
annualized premium sales by major insurance product
category for the years ended December 31.
Total new annualized premium sales for accident/disability
insurance, our leading product category, decreased 9.0%,
cancer indemnity insurance sales decreased 11.3% and
hospital indemnity insurance sales increased 1.7% in 2009,
compared with 2008.
We continued to enhance our product line in 2009 by
launching Essentials Accident and Essentials Maximum
Difference® cancer plans. These new products have been
streamlined with lower benet and premium levels than the
traditional cancer and accident insurance policies. In the
short term, we believe they are better suited to the current
economy and, in the long run, they will give consumers
more choices.
Another aspect of our U.S. sales strategy is our focus on
growing and improving our U.S. sales force. We remain
satised with our progress in the ongoing expansion of our
U.S. sales force. We recruited more than 28,400 new sales
associates in 2009, a 10.6% increase compared with 2008,
resulting in more than 75,300 licensed sales associates at
December 31, 2009. Newly established payroll accounts
were 10.6% higher in 2009, compared with 2008, suggesting
our brand message and business-to-business efforts are
reaching employers across the country. The number of new
average weekly producers, or those who are selling regularly
in their rst year, increased 6.2% during 2009, compared
with a year ago. We believe strong increases in new recruits
and new weekly producers, coupled with signicant payroll
account growth, will provide a solid foundation for future
sales when the U.S. economy recovers.
In the rst quarter of 2009, we implemented our new Aac
for BrokersSM initiative. Insurance brokers have been a
historically underleveraged sales channel for Aac, and we
believe we can establish relationships that will complement,
not compete with, our traditional distribution system. We
have assembled a management team experienced in broker
sales, and we are supporting this initiative with streamlined
products, targeted broker-specic advertising campaigns,
customized enrollment technology, and competitive
compensation. Additionally, a new level of management was
introduced in 2009 to deliver this initiative. Over 100 broker
development coordinators have been hired to be single
points of contact for brokers across the country. Broker
development coordinators are responsible for building
relationships with new brokers as well as strengthening
relationships with our current brokers. These coordinators
are assisted by a team of certied case managers whose
role is to coordinate and manage the account enrollments
for brokers.
Furthering our initiatives in the broker arena, we purchased
CAIC for $100 million in the fourth quarter of 2009. The
purchase was funded with internal capital. CAIC, which is
headquartered in Columbia, South Carolina, equips us with
a platform for offering attractive voluntary group insurance
products that are well-suited for distribution by insurance
Ratios to total revenues: 2009 2008 2007
Benefits and claims 51.7% 52.8% 52.9%
Operating expenses:
Amortization of deferred policy acquisition costs 8.5 7.7 7.3
Insurance commissions 10.3 10.2 10.8
Insurance and other expenses 13.8 13.7 13.4
Total operating expenses 32.6 31.6 31.5
Pretax operating earnings* 15.7 15.6 15.6
*See Page 30 for our definition of segment operating earnings.
(In millions) 2009 2008 2007
Total new annualized premium sales $ 1,453 $ 1,551 $ 1,558
Increase (decrease) over prior year (6.4)% (.4)% 9.5%
2009 2008 2007
Accident/disability 48% 49% 51%
Cancer 18 19 18
Hospital indemnity 18 16 14
Life 6 6 5
Fixed-benefit dental 5 5 6
Other 5 5 6
Total 100% 100% 100%
We’ve got you under our wing.
34