Aflac 2009 Annual Report Download - page 90
Download and view the complete annual report
Please find page 90 of the 2009 Aflac annual report below. You can navigate through the pages in the report by either clicking on the pages listed below, or by using the keyword search tool below to find specific information within the annual report.-
 1
1 -
2
-
3
-
4
-
5
-
6
-
7
-
8
-
9
-
10
-
11
-
12
-
13
-
14
-
15
-
16
-
17
-
18
-
19
-
20
-
21
-
22
-
23
-
24
-
25
-
26
-
27
-
28
-
29
-
30
-
31
-
32
-
33
-
34
-
35
-
36
-
37
-
38
-
39
-
40
-
41
-
42
-
43
-
44
-
45
-
46
-
47
-
48
-
49
-
50
-
51
-
52
-
53
-
54
-
55
-
56
-
57
-
58
-
59
-
60
-
61
-
62
-
63
-
64
-
65
-
66
-
67
-
68
-
69
-
70
-
71
-
72
-
73
-
74
-
75
-
76
-
77
-
78
-
79
-
 80
80 -
 81
81 -
 82
82 -
 83
83 -
 84
84 -
 85
85 -
 86
86 -
 87
87 -
 88
88 -
 89
89 -
 90
90 -
 91
91 -
 92
92 -
 93
93 -
 94
94 -
 95
95 -
 96
96 -
 97
97 -
 98
98
 |
 |

of statutory capital and surplus as of the previous year-end.
Dividends declared by Aac during 2010 in excess of $1.4
billion would require such approval. Dividends declared by
Aac during 2009 were $464 million.
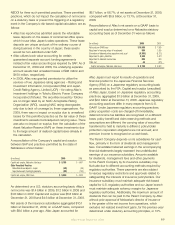
A portion of Aac Japan earnings, as determined on a
Japanese regulatory accounting basis, can be repatriated
each year to Aac U.S. after complying with solvency margin
provisions and satisfying various conditions imposed by
Japanese regulatory authorities for protecting policyholders.
Prot repatriations to the United States can uctuate due to
changes in the amounts of Japanese regulatory earnings.
Among other items, factors affecting regulatory earnings
include Japanese regulatory accounting practices and
uctuations in currency translation of Aac Japan’s dollar-
denominated investments and related investment income
into yen. Prots repatriated by Aac Japan to Aac U.S.
were as follows for the years ended December 31:
In Dollars In Yen
(In millions of dollars and billions of yen) 2009 2008 2007 2009 2008 2007
Profit repatriation $ 230 $ 598 $ 567 ¥ 20.0 ¥ 64.1 ¥ 67.8
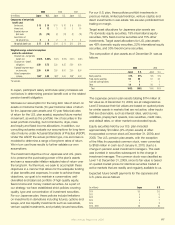
12. BENEFIT PLANS
Our basic employee dened-benet pension plans cover
substantially all of our full-time employees in the United
States and Japan.
Reconciliations of the funded status of the basic employee
dened-benet pension plans with amounts recognized in
the consolidated balance sheets as of December 31 were
as follows:
2009 2008
(In millions) Japan U.S. Japan U.S.
Projected benefit obligation:
Benefit obligation, beginning of year $ 169 $ 201 $ 125 $ 186
Service cost 13 10 11 10
Interest cost 4 12 3 11
Actuarial loss (gain) – 16 (1) (2)
Benefits paid (3) (4) (2) (4)
Effect of foreign exchange rate changes (2) – 33 –
Benefit obligation, end of year 181 235 169 201
Plan assets:
Fair value of plan assets, beginning of year 94 128 79 150
Actual return on plan assets 8 35 (16) (48)
Employer contribution 17 10 14 30
Benefits paid (4) (4) (2) (4)
Effect of foreign exchange rate changes (1) – 19 –
Fair value of plan assets, end of year 114 169 94 128
Funded status $ (67) $ (66) $ (75) $ (73)
Accumulated benefit obligation $ 156 $ 181 $ 146 $ 151
At December 31, 2009, other liabilities included a liability
for both plans in the amount of $133 million, compared
with $148 million a year ago. In December 2008, we pre-
funded $10 million to the U.S. plan that we had originally
planned to contribute in 2009. We accelerated the timing of
this contribution to improve the funded status of the plan in
light of the effect that market volatility had on plan asset fair
values. We plan to make contributions of $18 million to the
Japanese plan and $20 million to the U.S. plan in 2010.
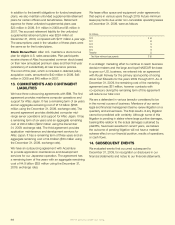
The following table summarizes the amounts included in
accumulated other comprehensive income as of
December 31.
2009 2008 2007
(In millions) Japan U.S. Japan U.S. Japan U.S.
Net actuarial loss $ 56 $ 92 $ 64 $ 102 $ 36 $ 47
Prior service cost (credit) (5) 1 (5) 1 (4) 1
Transition obligation 2 – 2 – 2 –
Total $ 53 $ 93 $ 61 $ 103 $ 34 $ 48
The following table summarizes the amounts recognized
in other comprehensive loss (income) for the years ended
December 31.
2009 2008 2007
(In millions) Japan U.S. Japan U.S. Japan U.S.
Net actuarial loss (gain) $ (5) $ (6) $ 17 $ 57 $ 2 $ (11)
Amortization of net actuarial loss (3) (4) (2) (2) (1) (4)
Total $ (8) $ (10) $ 15 $ 55 $ 1 $ (15)
No prior service costs or credits or transition obligations
arose during 2009, and the amounts of prior service costs
and credits and transition obligations amortized to expense
were immaterial for the years ended December 31, 2009,
2008 and 2007. Amortization of actuarial losses to expense
in 2010 is estimated to be $2 million for the Japanese plan
and $5 million for the U.S. plan, while the amortization of
prior service costs and credits and transition obligation are
expected to be negligible.
The components of retirement expense and actuarial
assumptions for the Japanese and U.S. pension plans for
the years ended December 31 appear in the table at the top
of the following page.
We’ve got you under our wing.
86