Aflac 2009 Annual Report Download - page 37
Download and view the complete annual report
Please find page 37 of the 2009 Aflac annual report below. You can navigate through the pages in the report by either clicking on the pages listed below, or by using the keyword search tool below to find specific information within the annual report.-
 1
1 -
2
-
3
-
4
-
5
-
6
-
7
-
8
-
9
-
10
-
11
-
12
-
13
-
14
-
15
-
16
-
17
-
18
-
19
-
20
-
21
-
22
-
23
-
24
-
25
-
26
-
 27
27 -
 28
28 -
 29
29 -
 30
30 -
 31
31 -
 32
32 -
 33
33 -
 34
34 -
 35
35 -
 36
36 -
 37
37 -
 38
38 -
 39
39 -
 40
40 -
 41
41 -
 42
42 -
 43
43 -
 44
44 -
 45
45 -
 46
46 -
 47
47 -
48
-
49
-
50
-
51
-
52
-
53
-
54
-
55
-
56
-
57
-
58
-
59
-
60
-
61
-
62
-
63
-
64
-
65
-
66
-
67
-
68
-
69
-
70
-
71
-
72
-
73
-
74
-
75
-
76
-
77
-
78
-
79
-
80
-
81
-
82
-
83
-
84
-
85
-
86
-
87
-
88
-
89
-
90
-
91
-
92
-
93
-
94
-
95
-
96
-
97
-
98
 |
 |

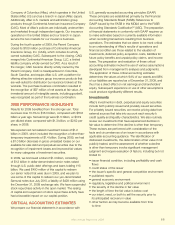
protective covenants appropriate to the specic issuer,
industry and country. These covenants often require the
issuer to adhere to specic nancial ratios and give priority to
repayment of our investment under certain circumstances.
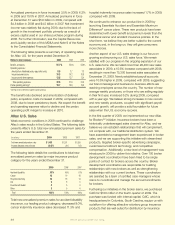
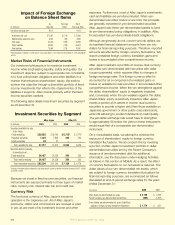
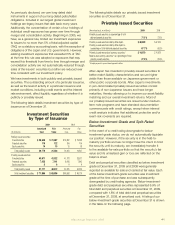
The following table presents the results of Aac Japan’s
investment activities for the years ended December 31.
At December 31, 2009, the yield on Aac Japan’s
investment portfolio, including dollar-denominated
investments, was 3.77%, compared with 3.90% a year
ago. The overall credit quality of Aac Japan’s investments
remained high. At the end of 2009, 93.4% of Aac Japan’s
debt and perpetual securities were rated investment grade,
on an amortized cost basis. See the Credit Risk section of
this MD&A for additional information.
Japanese Economy
The Bank of Japan’s January 2010 Monthly Report of
Recent Economic and Financial Developments stated that
Japan’s economic conditions have improved due to various
policy measures taken in Japan and abroad. Exports and
production have been increasing, and private consumption
is increasing despite the depressed employment and
income situation. The report projected that Japan’s
economic conditions are expected to continue to improve at
a moderate pace.
Japan’s system of compulsory public health care insurance
provides medical coverage to every Japanese citizen. These
public medical expenditures are covered by a combination
of premiums paid by insureds and their employers, taxes
and copayments from the people who receive medical
service. However, given Japan’s aging population, the
resources available to these publicly funded social insurance
programs have come under increasing pressure. As a
result, copayments and other out-of-pocket expenses
have been rising and affecting more people. We believe
higher out-of-pocket expenses will lead consumers to
purchase more supplemental medical insurance. Many
insurance companies have recognized the opportunities for
selling supplemental medical insurance in Japan and have
launched new products in recent years. However, we believe
our favorable cost structure compared with other insurers
makes us a very effective competitor. In addition, we believe
our brand, customer service and nancial strength also
benet our market position.
Japanese Regulatory Environment
We expect that our distribution system will continue to
evolve in Japan. Regulatory changes that took effect in
December 2007 enable banks to sell our third sector
products to their customers. Our strong brand as the
leading seller of cancer and medical insurance products
in Japan and our many long-term relationships within the
Japanese banking sector place us in a strong position to
sell through this new channel. By the end of 2009, we had
agreements with 353 banks to market Aac’s products.
The FSA maintains a solvency standard, which is used
by Japanese regulators to monitor the nancial strength
of insurance companies. As of December 31, 2009,
Aac Japan’s solvency margin ratio was 885.5%, which
signicantly exceeds regulatory minimums. The FSA has
issued a proposal to revise the current method of calculating
the solvency margin ratio. The FSA intends to apply the
revised method to life insurance companies for the scal
year-end 2011 (March 31, 2012) and require the disclosure
of the ratio as reference information for scal year-end
2010 (March 31, 2011). The FSA expects the revision would
generally reduce life insurance companies’ solvency margin
ratios to approximately half the level of those reported under
the current calculation method. We do not expect our
relative position within the industry to materially change.
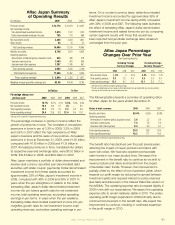
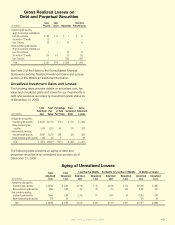
AFLAC U.S. SEGMENT
Aflac U.S. Pretax Operating Earnings
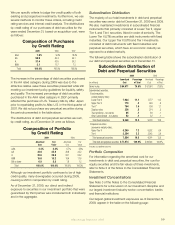
Changes in Aac U.S. pretax operating earnings and prot
margins are primarily affected by morbidity, mortality,
expenses, persistency and investment yields. The following
table presents a summary of operating results for Aac U.S.
for the years ended December 31.
2009 2008 2007
New money yield - yen only 2.80% 3.20% 3.05%
New money yield - blended 3.03 3.43 3.38
Return on average invested assets,
net of investment expenses 3.65 3.82 4.06
Aac U.S. Summary
of Operating Results
(In millions) 2009 2008 2007
Premium income $ 4,444 $ 4,272 $ 3,936
Net investment income 499 505 500
Other income 10 10 10
Total operating revenues 4,953 4,787 4,446
Benefits and claims 2,561 2,527 2,350
Operating expenses:
Amortization of deferred policy acquisition costs 419 370 323
Insurance commissions 508 488 481
Insurance and other expenses 689 657 600
Total operating expenses 1,616 1,515 1,404
Total benefits and expenses 4,177 4,042 3,754
Pretax operating earnings* $ 776 $ 745 $ 692
Percentage change over previous year:
Premium income 4.0% 8.5% 10.8%
Net investment income (1.1) .9 7.5
Total operating revenues 3.5 7.7 10.4
Pretax operating earnings* 4.1 7.6 18.3
*See Page 30 for our definition of segment operating earnings.
Aflac Annual Report for 2009 33