Aflac 2009 Annual Report Download - page 54
Download and view the complete annual report
Please find page 54 of the 2009 Aflac annual report below. You can navigate through the pages in the report by either clicking on the pages listed below, or by using the keyword search tool below to find specific information within the annual report.-
 1
1 -
2
-
3
-
4
-
5
-
6
-
7
-
8
-
9
-
10
-
11
-
12
-
13
-
14
-
15
-
16
-
17
-
18
-
19
-
20
-
21
-
22
-
23
-
24
-
25
-
26
-
27
-
28
-
29
-
30
-
31
-
32
-
33
-
34
-
35
-
36
-
37
-
38
-
39
-
40
-
41
-
42
-
43
-
 44
44 -
 45
45 -
 46
46 -
 47
47 -
 48
48 -
 49
49 -
 50
50 -
 51
51 -
 52
52 -
 53
53 -
 54
54 -
 55
55 -
 56
56 -
 57
57 -
 58
58 -
 59
59 -
 60
60 -
 61
61 -
 62
62 -
 63
63 -
 64
64 -
65
-
66
-
67
-
68
-
69
-
70
-
71
-
72
-
73
-
74
-
75
-
76
-
77
-
78
-
79
-
80
-
81
-
82
-
83
-
84
-
85
-
86
-
87
-
88
-
89
-
90
-
91
-
92
-
93
-
94
-
95
-
96
-
97
-
98
 |
 |

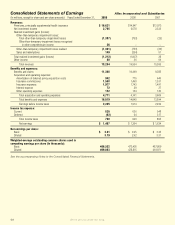
Consolidated Statements of Earnings Aac Incorporated and Subsidiaries
(In millions, except for share and per-share amounts) Years Ended December 31, 2009 2008 2007
Revenues:
Premiums, principally supplemental health insurance $ 16,621 $ 14,947 $ 12,973
Net investment income 2,765 2,578 2,333
Realized investment gains (losses):
Other-than-temporary impairment losses:
Total other-than-temporary impairment losses (1,387) (753) (23)
Other-than-temporary impairment losses recognized
in other comprehensive income 26 – –
Other-than-temporary impairment losses realized (1,361) (753) (23)
Sales and redemptions 149 (254) 51
Total realized investment gains (losses) (1,212) (1,007) 28
Other income 80 36 59
Total revenues 18,254 16,554 15,393
Benefits and expenses:
Benefits and claims 11,308 10,499 9,285
Acquisition and operating expenses:
Amortization of deferred policy acquisition costs 942 775 640
Insurance commissions 1,568 1,460 1,331
Insurance expenses 1,977 1,743 1,491
Interest expense 72 29 27
Other operating expenses 152 134 120
Total acquisition and operating expenses 4,711 4,141 3,609
Total benefits and expenses 16,019 14,640 12,894
Earnings before income taxes 2,235 1,914 2,499
Income tax expense:
Current 830 636 548
Deferred (92) 24 317
Total income taxes 738 660 865
Net earnings $ 1,497 $ 1,254 $ 1,634
Net earnings per share:
Basic $ 3.21 $ 2.65 $ 3.35
Diluted 3.19 2.62 3.31
Weighted-average outstanding common shares used in
computing earnings per share (In thousands):
Basic 466,552 473,405 487,869
Diluted 469,063 478,815 493,971
See the accompanying Notes to the Consolidated Financial Statements.
We’ve got you under our wing.
50