Aflac 2009 Annual Report Download - page 88
Download and view the complete annual report
Please find page 88 of the 2009 Aflac annual report below. You can navigate through the pages in the report by either clicking on the pages listed below, or by using the keyword search tool below to find specific information within the annual report.-
 1
1 -
2
-
3
-
4
-
5
-
6
-
7
-
8
-
9
-
10
-
11
-
12
-
13
-
14
-
15
-
16
-
17
-
18
-
19
-
20
-
21
-
22
-
23
-
24
-
25
-
26
-
27
-
28
-
29
-
30
-
31
-
32
-
33
-
34
-
35
-
36
-
37
-
38
-
39
-
40
-
41
-
42
-
43
-
44
-
45
-
46
-
47
-
48
-
49
-
50
-
51
-
52
-
53
-
54
-
55
-
56
-
57
-
58
-
59
-
60
-
61
-
62
-
63
-
64
-
65
-
66
-
67
-
68
-
69
-
70
-
71
-
72
-
73
-
74
-
75
-
76
-
77
-
 78
78 -
 79
79 -
 80
80 -
 81
81 -
 82
82 -
 83
83 -
 84
84 -
 85
85 -
 86
86 -
 87
87 -
 88
88 -
 89
89 -
 90
90 -
 91
91 -
 92
92 -
 93
93 -
 94
94 -
 95
95 -
 96
96 -
 97
97 -
 98
98
 |
 |

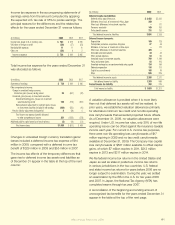
Stock Option Weighted-Average
(In thousands of shares) Shares Exercise Price Per Share
Outstanding at December 31, 2006 20,106 $ 30.48
Granted in 2007 1,244 49.35
Canceled in 2007 (133) 43.64
Exercised in 2007 (4,640) 20.94
Outstanding at December 31, 2007 16,577 34.46
Granted in 2008 1,703 59.78
Canceled in 2008 (146) 44.69
Exercised in 2008 (1,798) 25.91
Outstanding at December 31, 2008 16,336 37.95
Granted in 2009 2,220 26.74
Canceled in 2009 (161) 35.62
Exercised in 2009 (1,978) 26.13
Outstanding at December 31, 2009 16,417 $ 37.89
(In thousands of shares) 2009 2008 2007
Shares exercisable, end of year 12,523 12,382 12,653
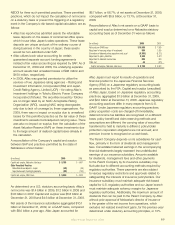
The following table summarizes information about stock
options outstanding and exercisable at December 31, 2009.
(In thousands of shares) Options Outstanding Options Exercisable
Stock Wgtd.-Avg. Weighted- Stock Weighted-
Range of Option Remaining Average Option Average
Exercise Prices Shares Contractual Exercise Shares Exercise
Per Share Outstanding Life (Yrs.) Price Per Share Exercisable Price Per Share
$ 14.99 – $ 23.23 3,238 4.8 $ 22.59 1,626 $ 23.10
23.65 – 31.71 3,376 2.7 29.62 3,371 29.62
31.73 – 40.43 3,745 5.1 39.32 3,289 39.28
40.61 – 47.25 3,224 6.4 44.69 3,027 44.73
47.33 – 62.18 2,749 7.8 55.27 1,205 53.54
62.41 – 67.67 85 8.3 65.76 5 67.45
$ 14.99 – $ 67.67 16,417 5.3 $ 37.89 12,523 $ 37.28
The aggregate intrinsic value represents the difference
between the company’s closing stock price of $46.25 as
of December 31, 2009, and the exercise price multiplied
by the number of options outstanding or exercisable as of
that date. As of December 31, 2009, the aggregate intrinsic
value of stock options outstanding was $165 million, with
a weighted-average remaining term of 5.3 years. The
aggregate intrinsic value of stock options exercisable at
that same date was $122 million, with a weighted-average
remaining term of 4.2 years.
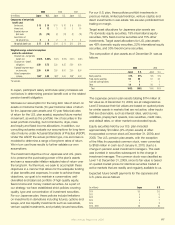
The following table summarizes stock option activity during
the years ended December 31.
(In millions) 2009 2008 2007
Total intrinsic value of options exercised $ 34 $ 59 $ 154
Cash received from options exercised 22 38 52
Tax benefit realized as a result of options exercised
and restricted stock releases 15 23 51
The value of restricted stock awards is based on the fair
market value of our common stock at the date of grant. The
following table summarizes restricted stock activity during
the years ended December 31.
Weighted-Average
Grant-Date Fair
(In thousands of shares) Shares Value Per Share
Restricted stock at December 31, 2006 613 $ 43.84
Granted in 2007 391 48.43
Canceled in 2007 (21) 45.88
Vested in 2007 (9) 42.06
Restricted stock at December 31, 2007 974 45.65
Granted in 2008 302 61.00
Canceled in 2008 (17) 52.86
Vested in 2008 (262) 39.95
Restricted stock at December 31, 2008 997 51.68
Granted in 2009 579 23.79
Canceled in 2009 (15) 39.97
Vested in 2009 (342) 47.30
Restricted stock at December 31, 2009 1,219 $ 39.81
As of December 31, 2009, total compensation cost not yet
recognized in our nancial statements related to restricted
stock awards was $18 million, of which $8 million (588
thousand shares) was related to restricted stock awards
with a performance-based vesting condition. We expect to
recognize these amounts over a weighted-average period
of approximately 1.3 years. There are no other contractual
terms covering restricted stock awards once vested.
11. STATUTORY ACCOUNTING AND
DIVIDEND RESTRICTIONS
Our insurance subsidiary is required to report its results
of operations and nancial position to state insurance
regulatory authorities on the basis of statutory accounting
practices prescribed or permitted by such authorities.
Aac’s statutory nancial statements are prepared on the
basis of accounting practices prescribed or permitted by
the Nebraska Department of Insurance (NEDOI). The NEDOI
recognizes statutory accounting principles and practices
prescribed or permitted by the state of Nebraska for
determining and reporting the nancial condition and results
of operations of an insurance company, and for determining
a company’s solvency under Nebraska insurance law. The
National Association of Insurance Commissioners’ (NAIC)
Accounting Practices and Procedures Manual, (SAP) has
been adopted by the state of Nebraska as a component of
those prescribed or permitted practices. Additionally, the
Director of the NEDOI has the right to permit other specic
practices which deviate from prescribed practices. Aac
has been given explicit permission by the Director of the
We’ve got you under our wing.
84