The Hartford 2010 Annual Report Download - page 98
Download and view the complete annual report
Please find page 98 of the 2010 The Hartford annual report below. You can navigate through the pages in the report by either clicking on the pages listed below, or by using the keyword search tool below to find specific information within the annual report.-
 1
1 -
2
-
3
-
4
-
5
-
6
-
7
-
8
-
9
-
10
-
11
-
12
-
13
-
14
-
15
-
16
-
17
-
18
-
19
-
20
-
21
-
22
-
23
-
24
-
25
-
26
-
27
-
28
-
29
-
30
-
31
-
32
-
33
-
34
-
35
-
36
-
37
-
38
-
39
-
40
-
41
-
42
-
43
-
44
-
45
-
46
-
47
-
48
-
49
-
50
-
51
-
52
-
53
-
54
-
55
-
56
-
57
-
58
-
59
-
60
-
61
-
62
-
63
-
64
-
65
-
66
-
67
-
68
-
69
-
70
-
71
-
72
-
73
-
74
-
75
-
76
-
77
-
78
-
79
-
80
-
81
-
82
-
83
-
84
-
85
-
86
-
87
-
 88
88 -
 89
89 -
 90
90 -
 91
91 -
 92
92 -
 93
93 -
 94
94 -
 95
95 -
 96
96 -
 97
97 -
 98
98 -
 99
99 -
 100
100 -
 101
101 -
 102
102 -
 103
103 -
 104
104 -
 105
105 -
 106
106 -
 107
107 -
 108
108 -
109
-
110
-
111
-
112
-
113
-
114
-
115
-
116
-
117
-
118
-
119
-
120
-
121
-
122
-
123
-
124
-
125
-
126
-
127
-
128
-
129
-
130
-
131
-
132
-
133
-
134
-
135
-
136
-
137
-
138
-
139
-
140
-
141
-
142
-
143
-
144
-
145
-
146
-
147
-
148
-
149
-
150
-
151
-
152
-
153
-
154
-
155
-
156
-
157
-
158
-
159
-
160
-
161
-
162
-
163
-
164
-
165
-
166
-
167
-
168
-
169
-
170
-
171
-
172
-
173
-
174
-
175
-
176
-
177
-
178
-
179
-
180
-
181
-
182
-
183
-
184
-
185
-
186
-
187
-
188
-
189
-
190
-
191
-
192
-
193
-
194
-
195
-
196
-
197
-
198
-
199
-
200
-
201
-
202
-
203
-
204
-
205
-
206
-
207
-
208
-
209
-
210
-
211
-
212
-
213
-
214
-
215
-
216
-
217
-
218
-
219
-
220
-
221
-
222
-
223
-
224
-
225
-
226
-
227
-
228
-
229
-
230
-
231
-
232
-
233
-
234
-
235
-
236
-
237
-
238
-
239
-
240
-
241
-
242
-
243
-
244
-
245
-
246
-
247
-
248
 |
 |

98
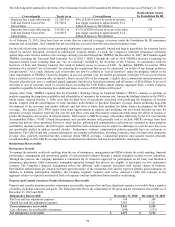
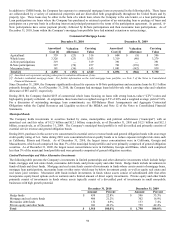
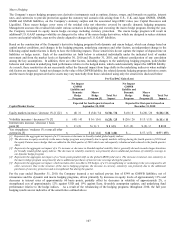
The following tables present the Company’ s unrealized loss aging for AFS securities continuously depressed over 20% by length of
time (included in the table above).
December 31, 2010 December 31, 2009
Consecutive Months
Items
Cost or
Amortized
Cost
Fair
Value
Unrealized
Loss
Items
Cost or
Amortized
Cost
Fair
Value
Unrealized
Loss
Three months or less 99 $ 771 $ 582 $ (189) 161 $ 951 $ 672 $ (279)
Greater than three to six months 22 136 104 (32) 51 55 38 (17)
Greater than six to nine months 28 234 169 (65) 159 2,046 1,397 (649)
Greater than nine to twelve months 13 43 32 (11) 86 1,398 913 (485)
Greater than twelve months 390 4,361 2,766 (1,595) 715 8,146 4,228 (3,918)
Total 552 $ 5,545 $ 3,653 $ (1,892) 1,172 $ 12,596 $ 7,248 $ (5,348)
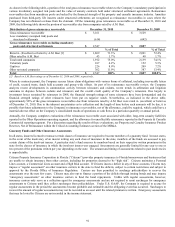
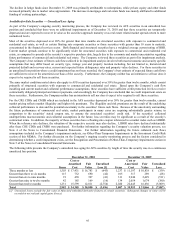
The following tables present the Company’ s unrealized loss aging for AFS securities continuously depressed over 50% by length of
time (included in the tables above).
December 31, 2010 December 31, 2009
Consecutive Months
Items
Cost or
Amortized
Cost
Fair
Value
Unrealized
Loss
Items
Cost or
Amortized
Cost
Fair
Value
Unrealized
Loss
Three months or less 20 $ 27 $ 12 $ (15) 62 $ 169 $ 61 $ (108)
Greater than three to six months 1 2 1 (1) 28 5 2 (3)
Greater than six to nine months 12 65 29 (36) 54 190 74 (116)
Greater than nine to twelve months — — — — 58 592 210 (382)
Greater than twelve months 94 722 260 (462) 220 2,553 735 (1,818)
Total 127 $ 816 $ 302 $ (514) 422 $ 3,509 $ 1,082 $ (2,427)
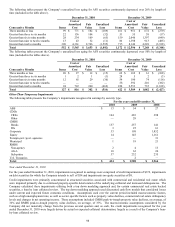
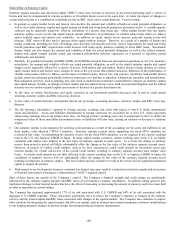
Other-Than-Temporary Impairments
The following table presents the Company’ s impairments recognized in earnings by security type.
For the years ended December 31,
2010 2009 2008
ABS $13 $ 54 $ 27
CDOs
CREs 164 483 398
Other — 28 —
CMBS
Bonds 157 257 141
IOs 3 25 61
Corporate 33 198 1,852
Equity 14 145 1,161
Foreign govt./govt. agencies — — 31
Municipal 1 18 21
RMBS
Non-agency 2 4 13
Alt-A 10 62 24
Sub-prime 37 232 235
U.S. Treasuries — 2 —
Total $434 $ 1,508 $3,964
Year ended December 31, 2010
For the year ended December 31, 2010, impairments recognized in earnings were comprised of credit impairments of $372, impairments
on debt securities for which the Company intends to sel1 of $54 and impairments on equity securities of $8.
Credit impairments were primarily concentrated in structured securities associated with commercial and residential real estate which
were impaired primarily due to continued property-specific deterioration of the underlying collateral and increased delinquencies. The
Company calculated these impairments utilizing both a top down modeling approach and, for certain commercial real estate backed
securities, a loan by loan collateral review. The top down modeling approach used discounted cash flow models that considered losses
under current and expected future economic conditions. Assumptions used over the current period included macroeconomic factors,
such as a high unemployment rate, as well as sector specific factors such as property value declines, commercial real estate delinquency
levels and changes in net operating income. Those assumptions included CMBS peak-to-trough property value declines, on average, of
36% and RMBS peak-to-trough property value declines, on average, of 35%. The macroeconomic assumptions considered by the
Company did not materially change from the previous several quarters and, as such, the credit impairments recognized for the year
ended December 31, 2010 were largely driven by actual or expected collateral deterioration, largely as a result of the Company’ s loan-
by-loan collateral review.