The Hartford 2010 Annual Report Download - page 67
Download and view the complete annual report
Please find page 67 of the 2010 The Hartford annual report below. You can navigate through the pages in the report by either clicking on the pages listed below, or by using the keyword search tool below to find specific information within the annual report.-
 1
1 -
2
-
3
-
4
-
5
-
6
-
7
-
8
-
9
-
10
-
11
-
12
-
13
-
14
-
15
-
16
-
17
-
18
-
19
-
20
-
21
-
22
-
23
-
24
-
25
-
26
-
27
-
28
-
29
-
30
-
31
-
32
-
33
-
34
-
35
-
36
-
37
-
38
-
39
-
40
-
41
-
42
-
43
-
44
-
45
-
46
-
47
-
48
-
49
-
50
-
51
-
52
-
53
-
54
-
55
-
56
-
 57
57 -
 58
58 -
 59
59 -
 60
60 -
 61
61 -
 62
62 -
 63
63 -
 64
64 -
 65
65 -
 66
66 -
 67
67 -
 68
68 -
 69
69 -
 70
70 -
 71
71 -
 72
72 -
 73
73 -
 74
74 -
 75
75 -
 76
76 -
 77
77 -
78
-
79
-
80
-
81
-
82
-
83
-
84
-
85
-
86
-
87
-
88
-
89
-
90
-
91
-
92
-
93
-
94
-
95
-
96
-
97
-
98
-
99
-
100
-
101
-
102
-
103
-
104
-
105
-
106
-
107
-
108
-
109
-
110
-
111
-
112
-
113
-
114
-
115
-
116
-
117
-
118
-
119
-
120
-
121
-
122
-
123
-
124
-
125
-
126
-
127
-
128
-
129
-
130
-
131
-
132
-
133
-
134
-
135
-
136
-
137
-
138
-
139
-
140
-
141
-
142
-
143
-
144
-
145
-
146
-
147
-
148
-
149
-
150
-
151
-
152
-
153
-
154
-
155
-
156
-
157
-
158
-
159
-
160
-
161
-
162
-
163
-
164
-
165
-
166
-
167
-
168
-
169
-
170
-
171
-
172
-
173
-
174
-
175
-
176
-
177
-
178
-
179
-
180
-
181
-
182
-
183
-
184
-
185
-
186
-
187
-
188
-
189
-
190
-
191
-
192
-
193
-
194
-
195
-
196
-
197
-
198
-
199
-
200
-
201
-
202
-
203
-
204
-
205
-
206
-
207
-
208
-
209
-
210
-
211
-
212
-
213
-
214
-
215
-
216
-
217
-
218
-
219
-
220
-
221
-
222
-
223
-
224
-
225
-
226
-
227
-
228
-
229
-
230
-
231
-
232
-
233
-
234
-
235
-
236
-
237
-
238
-
239
-
240
-
241
-
242
-
243
-
244
-
245
-
246
-
247
-
248
 |
 |

67
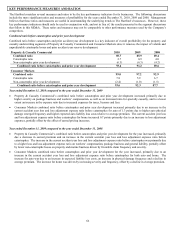
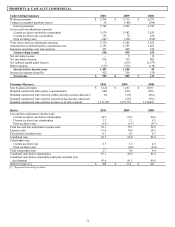
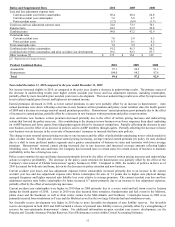
Return on Assets
Return on assets is a key indicator of overall profitability for the Global Annuity, Retirement Plans and Mutual Funds reporting
segments as a significant portion of their earnings is based on average assets under management.
[1] Proprietary mutual funds, Investment-Only mutual funds, Canadian mutual funds, and 529 college savings plans effective January 1, 2010, are
reported in the mutual fund business mix in 2010. Prior to 2010, proprietary mutual fund assets were included in Global Annuity, Retirement
Plans, and Mutual Funds, as those same assets generate earnings for each of these segments.
Year ended December 31, 2010 compared to year ended December 31, 2009
• Global Annuity’ s ROA, excluding realized losses and DAC Unlock, increased primarily due to improved net investment income on
limited partnerships and other alternative investments, a lower DAC amortization rate, improved operating expenses associated with
the restructuring of the international annuity operations and the absence of 3 Win charges recognized in the first quarter of 2009 of
$40, after-tax.
• Retirement Plans’ ROA, excluding realized losses and DAC Unlock, increased primarily due to improved performance on limited
partnerships and other alternative investments in 2010, and was driven by improvement in the equity markets, which led to
increased account values and increased deposit activity.
• Mutual Funds’ ROA, excluding realized gains, increase was primarily driven by improvement in the equity markets, which enabled
this business to partially return to scale, and the impact of lower operating expenses, partially offset by the addition of proprietary
mutual fund assets to this line of business, which has a lower ROA level than the non-proprietary business.
Year ended December 31, 2009 compared to year ended December 31, 2008
• Global Annuity’ s ROA, excluding realized losses and DAC Unlock, increased primarily due to the impact of the write off of
goodwill in 2008 of $274, after-tax, partially offset by higher DAC amortization and lower investment spread in 2009. In addition,
Global Annuity’ s ROA, excluding realized losses and DAC Unlock, for the year ended December 31, 2009 improved due to lower
3 Win related charges in 2009 versus 2008 of $40 and $152, after-tax, respectively.
• Retirement Plans’ ROA, excluding realized losses and DAC Unlock, decreased primarily due to lower returns on fixed maturities
and a full year of activity from the business acquired in 2008, which had produced a lower ROA.
• Mutual Funds’ ROA, excluding realized losses, decreased primarily due to lower account values, despite improvements in the
equity markets in 2009, account values did not return to 2008 levels.
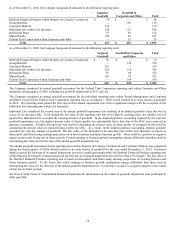
Ratios 2010 2009 2008
Global Annuity [1]
ROA 26.1 bps (75.0) bps (132.9) bps
Effect of net realized losses, net of tax and DAC on ROA (19.0) bps (53.3) bps (106.3) bps
Effect of DAC Unlock on ROA 4.9 bps (47.0) bps (49.1) bps
ROA, excluding realized losses and DAC Unlock 40.2 bps 25.3 bps 22.5 bps
Retirement Plans [1]
ROA 9.7 bps (54.8) bps (47.9) bps
Effect of net realized losses, net of tax and DAC on ROA (4.8) bps (46.4) bps (51.3) bps
Effect of DAC Unlock on ROA 5.4 bps (11.4) bps (14.6) bps
ROA, excluding realized losses and DAC Unlock 9.1 bps 3.0 bps 18.0 bps
Mutual Funds [1]
ROA 13.6 bps 8.8 bps 8.8 bps
Effect of net realized gains (losses), net of tax and DAC on ROA 4.3 bps — bps (0.2) bps
Effect of DAC Unlock on ROA — bps — bps (0.3) bps
ROA, excluding realized gains and DAC Unlock 9.3 bps 8.8 bps 9.3 bps