The Hartford 2010 Annual Report Download - page 169
Download and view the complete annual report
Please find page 169 of the 2010 The Hartford annual report below. You can navigate through the pages in the report by either clicking on the pages listed below, or by using the keyword search tool below to find specific information within the annual report.-
 1
1 -
2
-
3
-
4
-
5
-
6
-
7
-
8
-
9
-
10
-
11
-
12
-
13
-
14
-
15
-
16
-
17
-
18
-
19
-
20
-
21
-
22
-
23
-
24
-
25
-
26
-
27
-
28
-
29
-
30
-
31
-
32
-
33
-
34
-
35
-
36
-
37
-
38
-
39
-
40
-
41
-
42
-
43
-
44
-
45
-
46
-
47
-
48
-
49
-
50
-
51
-
52
-
53
-
54
-
55
-
56
-
57
-
58
-
59
-
60
-
61
-
62
-
63
-
64
-
65
-
66
-
67
-
68
-
69
-
70
-
71
-
72
-
73
-
74
-
75
-
76
-
77
-
78
-
79
-
80
-
81
-
82
-
83
-
84
-
85
-
86
-
87
-
88
-
89
-
90
-
91
-
92
-
93
-
94
-
95
-
96
-
97
-
98
-
99
-
100
-
101
-
102
-
103
-
104
-
105
-
106
-
107
-
108
-
109
-
110
-
111
-
112
-
113
-
114
-
115
-
116
-
117
-
118
-
119
-
120
-
121
-
122
-
123
-
124
-
125
-
126
-
127
-
128
-
129
-
130
-
131
-
132
-
133
-
134
-
135
-
136
-
137
-
138
-
139
-
140
-
141
-
142
-
143
-
144
-
145
-
146
-
147
-
148
-
149
-
150
-
151
-
152
-
153
-
154
-
155
-
156
-
157
-
158
-
 159
159 -
 160
160 -
 161
161 -
 162
162 -
 163
163 -
 164
164 -
 165
165 -
 166
166 -
 167
167 -
 168
168 -
 169
169 -
 170
170 -
 171
171 -
 172
172 -
 173
173 -
 174
174 -
 175
175 -
 176
176 -
 177
177 -
 178
178 -
 179
179 -
180
-
181
-
182
-
183
-
184
-
185
-
186
-
187
-
188
-
189
-
190
-
191
-
192
-
193
-
194
-
195
-
196
-
197
-
198
-
199
-
200
-
201
-
202
-
203
-
204
-
205
-
206
-
207
-
208
-
209
-
210
-
211
-
212
-
213
-
214
-
215
-
216
-
217
-
218
-
219
-
220
-
221
-
222
-
223
-
224
-
225
-
226
-
227
-
228
-
229
-
230
-
231
-
232
-
233
-
234
-
235
-
236
-
237
-
238
-
239
-
240
-
241
-
242
-
243
-
244
-
245
-
246
-
247
-
248
 |
 |

THE HARTFORD FINANCIAL SERVICES GROUP, INC.
NOTES TO CONSOLIDATED FINANCIAL STATEMENTS (continued)
F-41
5. Investments and Derivative Instruments (continued)
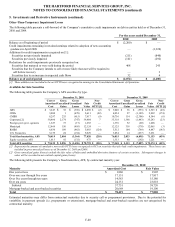
Concentration of Credit Risk
The Company aims to maintain a diversified investment portfolio including issuer, sector and geographic stratification, where
applicable, and has established certain exposure limits, diversification standards and review procedures to mitigate credit risk.
As of December 31, 2010, the Company was not exposed to any concentration of credit risk of a single issuer greater than 10% of the
Company’ s stockholders’ equity other than U.S. government and certain U.S. government agencies. Other than U.S. government and
certain U.S. government agencies, the Company’ s three largest exposures by issuer were JP Morgan Chase & Co., Wells Fargo & Co.
and AT&T Inc. which each comprised less than 0.5% of total invested assets. As of December 31, 2009, the Company was not exposed
to any concentration of credit risk of a single issuer greater than 10% of the Company’ s stockholders’ equity other than U.S. government
and certain U.S. government agencies. Other than U.S. government and certain U.S. government agencies, the Company’ s three largest
exposures by issuer were JP Morgan Chase & Co., Bank of America Corporation and Wells Fargo & Co. which each comprised less
than 0.5% of total invested assets.
The Company’ s three largest exposures by sector as of December 31, 2010 were commercial real estate, municipal investments and U.S.
Treasuries which comprised approximately 10%, 9% and 9%, respectively, of total invested assets. The Company’ s three largest
exposures by sector as of December 31, 2009 were commercial real estate, basic industry and municipal investments which comprised
approximately 12%, 10% and 10%, respectively, of total invested assets.
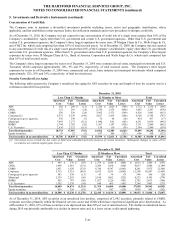
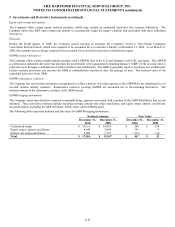
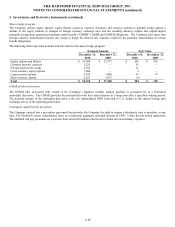
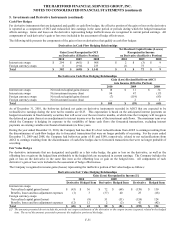
Security Unrealized Loss Aging
The following tables present the Company’ s unrealized loss aging for AFS securities by type and length of time the security was in a
continuous unrealized loss position.
December 31, 2010
Less Than 12 Months 12 Months or More Total
Amortized
Cost
Fair
Value
Unrealized
Losses
Amortized
Cost
Fair
Value
Unrealized
Losses
Amortized
Cost
Fair
Value
Unrealized
Losses
ABS $ 302 $ 290 $ (12) $ 1,410 $ 1,026 $ (384) $ 1,712 $ 1,316 $ (396)
CDOs 321 293 (28) 2,724 2,274 (450) 3,045 2,567 (478)
CMBS 556 530 (26) 3,962 3,373 (589) 4,518 3,903 (615)
Corporate [1] 5,533 5,329 (199) 4,017 3,435 (548) 9,550 8,764 (747)
Foreign govt./govt. agencies 356 349 (7) 78 68 (10) 434 417 (17)
Municipal 7,485 7,173 (312) 1,046 863 (183) 8,531 8,036 (495)
RMBS 1,744 1,702 (42) 1,567 1,147 (420) 3,311 2,849 (462)
U.S. Treasuries 2,436 2,321 (115) 158 119 (39) 2,594 2,440 (154)
Total fixed maturities 18,733 17,987 (741) 14,962 12,305 (2,623) 33,695 30,292 (3,364)
Equity securities 53 52 (1) 637 506 (131) 690 558 (132)
Total securities in an unrealized loss $ 18,786 $ 18,039 $ (742) $ 15,599 $ 12,811 $ (2,754) $ 34,385 $ 30,850 $ (3,496)
[1] Unrealized losses exclude the fair value of bifurcated embedded derivative features of certain securities. Subsequent changes in value will be
recorded in net realized capital gains (losses).
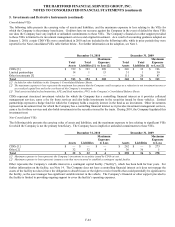
December 31, 2009
Less Than 12 Months 12 Months or More Total
Amortized
Cost
Fair
Value
Unrealized
Losses
Amortized
Cost
Fair
Value
Unrealized
Losses
Amortized
Cost
Fair
Value
Unrealized
Losses
ABS $ 445 $ 376 $ (69) $ 1,574 $ 1,090 $ (484) $ 2,019 $ 1,466 $ (553)
CDOs 1,649 1,418 (231) 2,388 1,430 (958) 4,037 2,848 (1,189)
CMBS 1,951 1,628 (323) 6,330 4,347 (1,983) 8,281 5,975 (2,306)
Corporate 5,715 5,314 (401) 6,675 5,633 (1,042) 12,390 10,947 (1,443)
Foreign govt./govt. agencies 543 530 (13) 43 36 (7) 586 566 (20)
Municipal 2,339 2,283 (56) 2,184 1,862 (322) 4,523 4,145 (378)
RMBS 855 787 (68) 1,927 1,226 (701) 2,782 2,013 (769)
U.S. Treasuries 2,592 2,538 (54) 648 465 (183) 3,240 3,003 (237)
Total fixed maturities 16,089 14,874 (1,215) 21,769 16,089 (5,680) 37,858 30,963 (6,895)
Equity securities 419 356 (63) 676 547 (129) 1,095 903 (192)
Total securities in an unrealized loss $ 16,508 $ 15,230 $ (1,278) $ 22,445 $ 16,636 $ (5,809) $ 38,953 $ 31,866 $ (7,087)
As of December 31, 2010, AFS securities in an unrealized loss position, comprised of 2,982 securities, primarily related to CMBS,
corporate securities primarily within the financial services sector and CDOs which have experienced significant price deterioration. As
of December 31, 2010, 81% of these securities were depressed less than 20% of cost or amortized cost. The decline in unrealized losses
during 2010 was primarily attributable to a decline in interest rates and, to a lesser extent, credit spread tightening.