The Hartford 2010 Annual Report Download - page 179
Download and view the complete annual report
Please find page 179 of the 2010 The Hartford annual report below. You can navigate through the pages in the report by either clicking on the pages listed below, or by using the keyword search tool below to find specific information within the annual report.-
 1
1 -
2
-
3
-
4
-
5
-
6
-
7
-
8
-
9
-
10
-
11
-
12
-
13
-
14
-
15
-
16
-
17
-
18
-
19
-
20
-
21
-
22
-
23
-
24
-
25
-
26
-
27
-
28
-
29
-
30
-
31
-
32
-
33
-
34
-
35
-
36
-
37
-
38
-
39
-
40
-
41
-
42
-
43
-
44
-
45
-
46
-
47
-
48
-
49
-
50
-
51
-
52
-
53
-
54
-
55
-
56
-
57
-
58
-
59
-
60
-
61
-
62
-
63
-
64
-
65
-
66
-
67
-
68
-
69
-
70
-
71
-
72
-
73
-
74
-
75
-
76
-
77
-
78
-
79
-
80
-
81
-
82
-
83
-
84
-
85
-
86
-
87
-
88
-
89
-
90
-
91
-
92
-
93
-
94
-
95
-
96
-
97
-
98
-
99
-
100
-
101
-
102
-
103
-
104
-
105
-
106
-
107
-
108
-
109
-
110
-
111
-
112
-
113
-
114
-
115
-
116
-
117
-
118
-
119
-
120
-
121
-
122
-
123
-
124
-
125
-
126
-
127
-
128
-
129
-
130
-
131
-
132
-
133
-
134
-
135
-
136
-
137
-
138
-
139
-
140
-
141
-
142
-
143
-
144
-
145
-
146
-
147
-
148
-
149
-
150
-
151
-
152
-
153
-
154
-
155
-
156
-
157
-
158
-
159
-
160
-
161
-
162
-
163
-
164
-
165
-
166
-
167
-
168
-
 169
169 -
 170
170 -
 171
171 -
 172
172 -
 173
173 -
 174
174 -
 175
175 -
 176
176 -
 177
177 -
 178
178 -
 179
179 -
 180
180 -
 181
181 -
 182
182 -
 183
183 -
 184
184 -
 185
185 -
 186
186 -
 187
187 -
 188
188 -
 189
189 -
190
-
191
-
192
-
193
-
194
-
195
-
196
-
197
-
198
-
199
-
200
-
201
-
202
-
203
-
204
-
205
-
206
-
207
-
208
-
209
-
210
-
211
-
212
-
213
-
214
-
215
-
216
-
217
-
218
-
219
-
220
-
221
-
222
-
223
-
224
-
225
-
226
-
227
-
228
-
229
-
230
-
231
-
232
-
233
-
234
-
235
-
236
-
237
-
238
-
239
-
240
-
241
-
242
-
243
-
244
-
245
-
246
-
247
-
248
 |
 |

THE HARTFORD FINANCIAL SERVICES GROUP, INC.
NOTES TO CONSOLIDATED FINANCIAL STATEMENTS (continued)
F-51
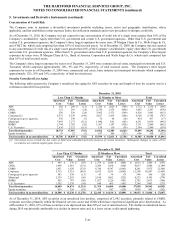
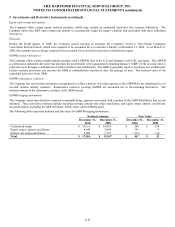
5. Investments and Derivative Instruments (continued)
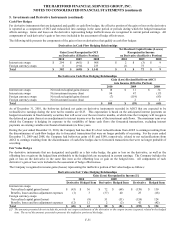
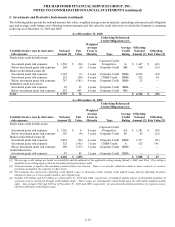
Cash Flow Hedges
For derivative instruments that are designated and qualify as cash flow hedges, the effective portion of the gain or loss on the derivative
is reported as a component of OCI and reclassified into earnings in the same period or periods during which the hedged transaction
affects earnings. Gains and losses on the derivative representing hedge ineffectiveness are recognized in current period earnings. All
components of each derivative’ s gain or loss were included in the assessment of hedge effectiveness.
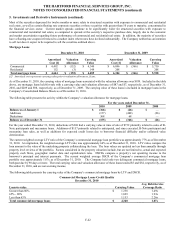
The following table presents the components of the gain or loss on derivatives that qualify as cash flow hedges:
Derivatives in Cash Flow Hedging Relationships
Gain (Loss) Recognized in OCI
on Derivative (Effective Portion)
Net Realized Capital Gains (Losses)
Recognized in Income
on Derivative (Ineffective Portion)
2010 2009 2008 2010 2009 2008
Interest rate swaps $ 294 $ (461) $ 908 $ 2 $ (3) $ 9
Foreign currency swaps 8 (194) 233 (1) 75 —
Total $ 302 $ (655) $ 1,141 $ 1 $ 72 $ 9
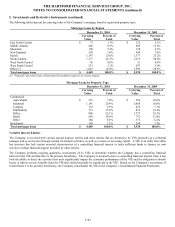
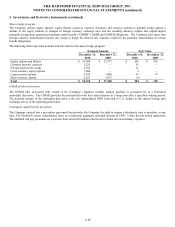
Derivatives in Cash Flow Hedging Relationships
Gain (Loss) Reclassified from AOCI
into Income (Effective Portion)
2010 2009 2008
Interest rate swaps Net realized capital gains (losses) $ 18 $ 11 $ 34
Interest rate swaps Net investment income (loss) 94 47 (17)
Foreign currency swaps Net realized capital gains (losses) (7) (119) (83)
Foreign currency swaps Net investment income (loss) — 2 1
Total $ 105 $ (59) $ (65)
As of December 31, 2010, the before-tax deferred net gains on derivative instruments recorded in AOCI that are expected to be
reclassified to earnings during the next twelve months are $123. This expectation is based on the anticipated interest payments on
hedged investments in fixed maturity securities that will occur over the next twelve months, at which time the Company will recognize
the deferred net gains (losses) as an adjustment to interest income over the term of the investment cash flows. The maximum term over
which the Company is hedging its exposure to the variability of future cash flows (for forecasted transactions, excluding interest
payments on existing variable-rate financial instruments) is three years.
During the year ended December 31, 2010, the Company had less than $1 of net reclassifications from AOCI to earnings resulting from
the discontinuance of cash-flow hedges due to forecasted transactions that were no longer probable of occurring. For the years ended
December 31, 2009 and 2008, the Company had before-tax gains of $1 and $198, respectively, related to net reclassifications from
AOCI to earnings resulting from the discontinuance of cash-flow hedges due to forecasted transactions that were no longer probable of
occurring.
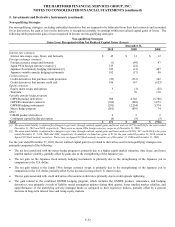
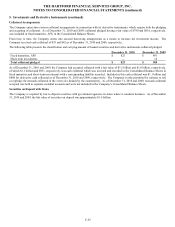
Fair Value Hedges
For derivative instruments that are designated and qualify as a fair value hedge, the gain or loss on the derivative, as well as the
offsetting loss or gain on the hedged item attributable to the hedged risk are recognized in current earnings. The Company includes the
gain or loss on the derivative in the same line item as the offsetting loss or gain on the hedged item. All components of each
derivative’ s gain or loss were included in the assessment of hedge effectiveness.
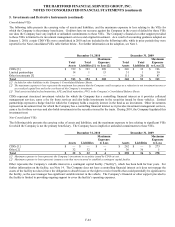
The Company recognized in income gains (losses) representing the ineffective portion of fair value hedges as follows:
Derivatives in Fair Value Hedging Relationships
Gain (Loss) Recognized in Income [1]
2010 2009 2008
Derivative Hedged Item Derivative Hedged Item Derivative Hedged Item
Interest rate swaps
Net realized capital gains (losses) $ (43) $ 36 $ 72 $ (68) $ (138) $ 130
Benefits, losses and loss adjustment expenses (1) 3 (37) 40 25 (18)
Foreign currency swaps
Net realized capital gains (losses) 8 (8) 51 (51) (124) 124
Benefits, losses and loss adjustment expenses (12) 12 2 (2) 42 (42)
Total $ (48) $ 43 $ 88 $ (81) $ (195) $ 194
[1] The amounts presented do not include the periodic net coupon settlements of the derivative or the coupon income (expense) related to the hedged
item. The net of the amounts presented represents the ineffective portion of the hedge.