The Hartford 2010 Annual Report Download - page 200
Download and view the complete annual report
Please find page 200 of the 2010 The Hartford annual report below. You can navigate through the pages in the report by either clicking on the pages listed below, or by using the keyword search tool below to find specific information within the annual report.-
 1
1 -
2
-
3
-
4
-
5
-
6
-
7
-
8
-
9
-
10
-
11
-
12
-
13
-
14
-
15
-
16
-
17
-
18
-
19
-
20
-
21
-
22
-
23
-
24
-
25
-
26
-
27
-
28
-
29
-
30
-
31
-
32
-
33
-
34
-
35
-
36
-
37
-
38
-
39
-
40
-
41
-
42
-
43
-
44
-
45
-
46
-
47
-
48
-
49
-
50
-
51
-
52
-
53
-
54
-
55
-
56
-
57
-
58
-
59
-
60
-
61
-
62
-
63
-
64
-
65
-
66
-
67
-
68
-
69
-
70
-
71
-
72
-
73
-
74
-
75
-
76
-
77
-
78
-
79
-
80
-
81
-
82
-
83
-
84
-
85
-
86
-
87
-
88
-
89
-
90
-
91
-
92
-
93
-
94
-
95
-
96
-
97
-
98
-
99
-
100
-
101
-
102
-
103
-
104
-
105
-
106
-
107
-
108
-
109
-
110
-
111
-
112
-
113
-
114
-
115
-
116
-
117
-
118
-
119
-
120
-
121
-
122
-
123
-
124
-
125
-
126
-
127
-
128
-
129
-
130
-
131
-
132
-
133
-
134
-
135
-
136
-
137
-
138
-
139
-
140
-
141
-
142
-
143
-
144
-
145
-
146
-
147
-
148
-
149
-
150
-
151
-
152
-
153
-
154
-
155
-
156
-
157
-
158
-
159
-
160
-
161
-
162
-
163
-
164
-
165
-
166
-
167
-
168
-
169
-
170
-
171
-
172
-
173
-
174
-
175
-
176
-
177
-
178
-
179
-
180
-
181
-
182
-
183
-
184
-
185
-
186
-
187
-
188
-
189
-
 190
190 -
 191
191 -
 192
192 -
 193
193 -
 194
194 -
 195
195 -
 196
196 -
 197
197 -
 198
198 -
 199
199 -
 200
200 -
 201
201 -
 202
202 -
 203
203 -
 204
204 -
 205
205 -
 206
206 -
 207
207 -
 208
208 -
 209
209 -
 210
210 -
211
-
212
-
213
-
214
-
215
-
216
-
217
-
218
-
219
-
220
-
221
-
222
-
223
-
224
-
225
-
226
-
227
-
228
-
229
-
230
-
231
-
232
-
233
-
234
-
235
-
236
-
237
-
238
-
239
-
240
-
241
-
242
-
243
-
244
-
245
-
246
-
247
-
248
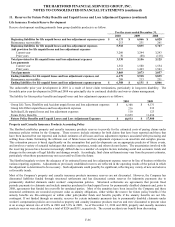
 |
 |

THE HARTFORD FINANCIAL SERVICES GROUP, INC.
NOTES TO CONSOLIDATED FINANCIAL STATEMENTS (continued)
F-72
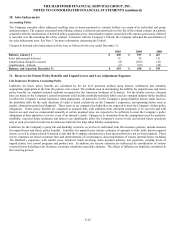
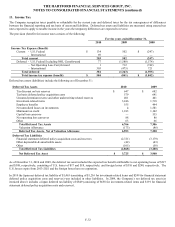
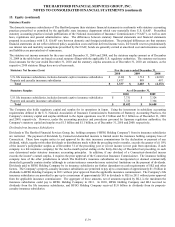
13. Income Tax
The Company recognizes taxes payable or refundable for the current year and deferred taxes for the tax consequences of differences
between the financial reporting and tax basis of assets and liabilities. Deferred tax assets and liabilities are measured using enacted tax
rates expected to apply to taxable income in the years the temporary differences are expected to reverse.
The provision (benefit) for income taxes consists of the following:
For the years ended December 31,
2010 2009 2008
Income Tax Expense (Benefit)
Current - U.S. Federal $134 502 $ (247)
- International 69 –– ––
Total current 203 502 (247)
Deferred - U.S. Federal Excluding NOL Carryforward 77 (1,580) (1,574)
- Net Operating Loss Carryforward 1 712 (742)
- International 303 (475) 721
Total deferred 381 (1,343) (1,595)
Total income tax expense (benefit) $584 (841) $ (1,842)
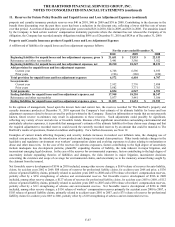
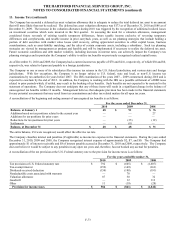
Deferred tax assets (liabilities) include the following as of December 31:
Deferred Tax Assets 2010 2009
Tax discount on loss reserves $647 $682
Tax basis deferred policy acquisition costs 579 641
Unearned premium reserve and other underwriting related reserves 401 401
Investment-related items 3,246 1,718
Employee benefits 555 494
Net unrealized losses on investments 4 1,581
Minimum tax credit 1,183 1,102
Capital loss carryover –– 535
Net operating loss carryover 88 86
Other 63 66
Total Deferred Tax Assets 6,766 7,306
Valuation Allowance (173) (86)
Deferred Tax Assets, Net of Valuation Allowance 6,593 7,220
Deferred Tax Liabilities
Financial statement deferred policy acquisition costs and reserves (2,721) (3,179)
Other depreciable & amortizable assets (42) (43)
Other (105) (58)
Total Deferred Tax Liabilities (2,868) (3,280)
Net Deferred Tax Asset $3,725 $3,940
As of December 31, 2010 and 2009, the deferred tax asset included the expected tax benefit attributable to net operating losses of $327
and $308, respectively, consisting of U.S. losses of $17 and $18, respectively, and foreign losses of $310 and $290, respectively. The
U.S. losses expire from 2013-2021 and the foreign losses have no expiration.
In 2010 the Japan net deferred tax liability of $1,465 (consisting of $1,216 for investment-related items and $249 for financial statement
deferred policy acquisition costs and reserves) was included in other liabilities. In 2009, the Company’ s net deferred tax asset (as
itemized above) includes a Japan deferred tax liability of $849 (consisting of $658 for investment-related items and $191 for financial
statement deferred policy acquisition costs and reserves).