The Hartford 2010 Annual Report Download - page 82
Download and view the complete annual report
Please find page 82 of the 2010 The Hartford annual report below. You can navigate through the pages in the report by either clicking on the pages listed below, or by using the keyword search tool below to find specific information within the annual report.-
 1
1 -
2
-
3
-
4
-
5
-
6
-
7
-
8
-
9
-
10
-
11
-
12
-
13
-
14
-
15
-
16
-
17
-
18
-
19
-
20
-
21
-
22
-
23
-
24
-
25
-
26
-
27
-
28
-
29
-
30
-
31
-
32
-
33
-
34
-
35
-
36
-
37
-
38
-
39
-
40
-
41
-
42
-
43
-
44
-
45
-
46
-
47
-
48
-
49
-
50
-
51
-
52
-
53
-
54
-
55
-
56
-
57
-
58
-
59
-
60
-
61
-
62
-
63
-
64
-
65
-
66
-
67
-
68
-
69
-
70
-
71
-
 72
72 -
 73
73 -
 74
74 -
 75
75 -
 76
76 -
 77
77 -
 78
78 -
 79
79 -
 80
80 -
 81
81 -
 82
82 -
 83
83 -
 84
84 -
 85
85 -
 86
86 -
 87
87 -
 88
88 -
 89
89 -
 90
90 -
 91
91 -
 92
92 -
93
-
94
-
95
-
96
-
97
-
98
-
99
-
100
-
101
-
102
-
103
-
104
-
105
-
106
-
107
-
108
-
109
-
110
-
111
-
112
-
113
-
114
-
115
-
116
-
117
-
118
-
119
-
120
-
121
-
122
-
123
-
124
-
125
-
126
-
127
-
128
-
129
-
130
-
131
-
132
-
133
-
134
-
135
-
136
-
137
-
138
-
139
-
140
-
141
-
142
-
143
-
144
-
145
-
146
-
147
-
148
-
149
-
150
-
151
-
152
-
153
-
154
-
155
-
156
-
157
-
158
-
159
-
160
-
161
-
162
-
163
-
164
-
165
-
166
-
167
-
168
-
169
-
170
-
171
-
172
-
173
-
174
-
175
-
176
-
177
-
178
-
179
-
180
-
181
-
182
-
183
-
184
-
185
-
186
-
187
-
188
-
189
-
190
-
191
-
192
-
193
-
194
-
195
-
196
-
197
-
198
-
199
-
200
-
201
-
202
-
203
-
204
-
205
-
206
-
207
-
208
-
209
-
210
-
211
-
212
-
213
-
214
-
215
-
216
-
217
-
218
-
219
-
220
-
221
-
222
-
223
-
224
-
225
-
226
-
227
-
228
-
229
-
230
-
231
-
232
-
233
-
234
-
235
-
236
-
237
-
238
-
239
-
240
-
241
-
242
-
243
-
244
-
245
-
246
-
247
-
248
 |
 |

82
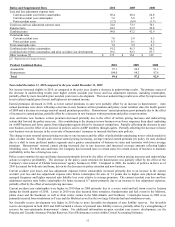
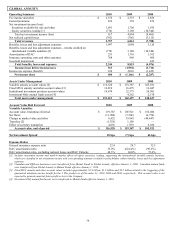
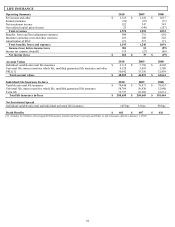
LIFE INSURANCE
Operating Summary 2010 2009 2008
Fee income and other $ 1,125 $ 1,141 $1,017
Earned premiums (96) (87) (71)
Net investment income 522 347 343
Net realized capital gains (losses) 23 (149) (257)
Total revenues 1,574 1,252 1,032
Benefits, losses and loss adjustment expenses 849 715 692
Insurance operating costs and other expenses 223 208 228
Amortization of DAC 121 317 171
Total benefits, losses and expenses 1,193 1,240 1,091
Income (loss) before income taxes 381 12 (59)
Income tax expense (benefit) 119 (27) (40)
Net income (loss) $ 262 $ 39 $(19)
Account Values 2010 2009 2008
Individual variable universal life insurance $6,115 $ 5,766 $4,802
Universal life, interest sensitive whole life, modified guaranteed life insurance and other 6,128 5,693 5,380
PPLI [1] 36,042 33,356 32,459
Total account values $48,285 $ 44,815 $42,641
Individual Life Insurance In-force 2010 2009 2008
Variable universal life insurance $74,044 $ 78,671 $78,853
Universal life, interest sensitive whole life, modified guaranteed life insurance 58,789 56,030 52,980
Term life 75,797 69,968 63,631
Total life insurance in-force $208,630 $ 204,669 $195,464
Net Investment Spread
Individual variable universal and individual universal life insurance 145 bps 81 bps 90 bps
Death Benefits
$ 461 $ 407 $416
[1] Includes $1.8 billion of leveraged COLI business transferred from Corporate and Other to Life Insurance effective January 1, 2010.