The Hartford 2010 Annual Report Download - page 69
Download and view the complete annual report
Please find page 69 of the 2010 The Hartford annual report below. You can navigate through the pages in the report by either clicking on the pages listed below, or by using the keyword search tool below to find specific information within the annual report.-
 1
1 -
2
-
3
-
4
-
5
-
6
-
7
-
8
-
9
-
10
-
11
-
12
-
13
-
14
-
15
-
16
-
17
-
18
-
19
-
20
-
21
-
22
-
23
-
24
-
25
-
26
-
27
-
28
-
29
-
30
-
31
-
32
-
33
-
34
-
35
-
36
-
37
-
38
-
39
-
40
-
41
-
42
-
43
-
44
-
45
-
46
-
47
-
48
-
49
-
50
-
51
-
52
-
53
-
54
-
55
-
56
-
57
-
58
-
 59
59 -
 60
60 -
 61
61 -
 62
62 -
 63
63 -
 64
64 -
 65
65 -
 66
66 -
 67
67 -
 68
68 -
 69
69 -
 70
70 -
 71
71 -
 72
72 -
 73
73 -
 74
74 -
 75
75 -
 76
76 -
 77
77 -
 78
78 -
 79
79 -
80
-
81
-
82
-
83
-
84
-
85
-
86
-
87
-
88
-
89
-
90
-
91
-
92
-
93
-
94
-
95
-
96
-
97
-
98
-
99
-
100
-
101
-
102
-
103
-
104
-
105
-
106
-
107
-
108
-
109
-
110
-
111
-
112
-
113
-
114
-
115
-
116
-
117
-
118
-
119
-
120
-
121
-
122
-
123
-
124
-
125
-
126
-
127
-
128
-
129
-
130
-
131
-
132
-
133
-
134
-
135
-
136
-
137
-
138
-
139
-
140
-
141
-
142
-
143
-
144
-
145
-
146
-
147
-
148
-
149
-
150
-
151
-
152
-
153
-
154
-
155
-
156
-
157
-
158
-
159
-
160
-
161
-
162
-
163
-
164
-
165
-
166
-
167
-
168
-
169
-
170
-
171
-
172
-
173
-
174
-
175
-
176
-
177
-
178
-
179
-
180
-
181
-
182
-
183
-
184
-
185
-
186
-
187
-
188
-
189
-
190
-
191
-
192
-
193
-
194
-
195
-
196
-
197
-
198
-
199
-
200
-
201
-
202
-
203
-
204
-
205
-
206
-
207
-
208
-
209
-
210
-
211
-
212
-
213
-
214
-
215
-
216
-
217
-
218
-
219
-
220
-
221
-
222
-
223
-
224
-
225
-
226
-
227
-
228
-
229
-
230
-
231
-
232
-
233
-
234
-
235
-
236
-
237
-
238
-
239
-
240
-
241
-
242
-
243
-
244
-
245
-
246
-
247
-
248
 |
 |

69
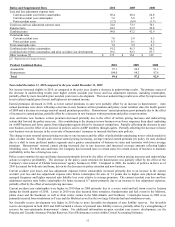
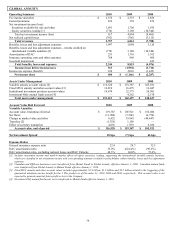
Investment Results
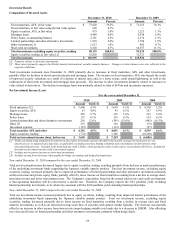
Composition of Invested Assets
December 31, 2010 December 31, 2009
Amount Percent
Amount Percent
Fixed maturities, AFS, at fair value $ 77,820 79.2% $ 71,153 76.3%
Fixed maturities, at fair value using the fair value option 649 0.7% –– ––
Equity securities, AFS, at fair value 973 1.0% 1,221 1.3%
Mortgage loans 4,489 4.6% 5,938 6.4%
Policy loans, at outstanding balance 2,181 2.2% 2,174 2.3%
Limited partnerships and other alternative investments 1,918 2.0% 1,790 1.9%
Other investments [1] 1,617 1.6% 602 0.7%
Short-term investments 8,528 8.7% 10,357 11.1%
Total investments excluding equity securities, trading 98,175 100.0% 93,235 100.0%
Equity securities, trading, at fair value [2] 32,820 32,321
Total investments $ 130,995 $ 125,556
[1] Primarily relates to derivative instruments.
[2] These assets primarily support the Global Annuity-International variable annuity business. Changes in these balances are also reflected in the
respective liabilities.
Total investments increased since December 31, 2009 primarily due to increases in fixed maturities, AFS, and other investments,
partially offset by declines in short-term investments and mortgage loans. The increase in fixed maturities, AFS, was largely the result
of improved security valuations as a result of a decline in interest rates and, to a lesser extent, credit spread tightening, as well as the
reallocation of short-term investment and mortgage loan proceeds. The increase in other investments primarily related to increases in
value related to derivatives. The decline in mortgage loans was primarily related to sales of B-Note and mezzanine exposures.
Net Investment Income (Loss)
For the years ended December 31,
2010 2009 2008
Amount Yield [1] Amount Yield [1] Amount Yield [1]
Fixed maturities [2] $3,490 4.3% $ 3,618 4.5% $ 4,310 5.2%
Equity securities, AFS 53 4.8% 93 6.5% 167 6.9%
Mortgage loans 283 5.7% 316 5.0% 333 5.6%
Policy loans 132 6.1% 139 6.3% 139 6.5%
Limited partnerships and other alternative investments 216 12.6% (341) (15.6%) (445) (16.3%)
Other [3] 333 318 (72)
Investment expense (115) (112) (97)
Total securities AFS and other $4,392 4.5% $ 4,031 4.1% $ 4,335 4.6%
Equity securities, trading (774) 3,188 (10,340)
Total net investment income (loss), before-tax $3,618 $ 7,219 $ (6,005)
[1] Yields calculated using annualized investment income before investment expenses divided by the monthly average invested assets at cost,
amortized cost, or adjusted carrying value, as applicable, excluding securities lending collateral and consolidated variable interest entity
noncontrolling interests. Included in the fixed maturity yield is Other, which primarily relates to derivatives (see footnote [3] below). Included in
the total net investment income yield is investment expense.
[2] Includes net investment income on short-term investments.
[3] Includes income from derivatives that qualify for hedge accounting and hedge fixed maturities.
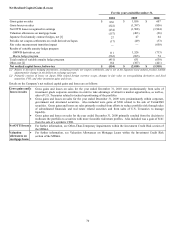
Year ended December 31, 2010 compared to the year ended December 31, 2009
Total net investment income decreased largely due to equity securities, trading, resulting primarily from declines in market performance
of the underlying investment funds supporting the Japanese variable annuity product. Total net investment income, excluding equity
securities, trading, increased primarily due to improved performance of limited partnerships and other alternative investments primarily
within real estate and private equity funds, partially offset by lower income on fixed maturities resulting from a decline in average short-
term interest rates and lower reinvestment rates. The Company's expectation, based on the current interest rate and credit environment,
is that upcoming maturities will be reinvested at a similar rate. Therefore, the Company expects the 2011 portfolio yield, excluding
limited partnership investments, to be relatively consistent with the 2010 portfolio yield excluding limited partnerships.
Year ended December 31, 2009 compared to the year ended December 31, 2008
Total net investment income increased primarily due to equity securities, trading, resulting from improved market performance of the
underlying investment funds supporting the Japanese variable annuity product. Total net investment income, excluding equity
securities, trading, decreased primarily due to lower income on fixed maturities resulting from a decline in average rates and fixed
maturity investments, as well as an increased average asset base of securities with greater market liquidity. The decrease was partially
offset by an increase in other income from interest rate swaps hedging variable rate bonds due to a decrease in LIBOR. Also offsetting
were decreased losses on limited partnerships and other alternative investments, primarily within hedge funds.