The Hartford 2010 Annual Report Download - page 74
Download and view the complete annual report
Please find page 74 of the 2010 The Hartford annual report below. You can navigate through the pages in the report by either clicking on the pages listed below, or by using the keyword search tool below to find specific information within the annual report.-
 1
1 -
2
-
3
-
4
-
5
-
6
-
7
-
8
-
9
-
10
-
11
-
12
-
13
-
14
-
15
-
16
-
17
-
18
-
19
-
20
-
21
-
22
-
23
-
24
-
25
-
26
-
27
-
28
-
29
-
30
-
31
-
32
-
33
-
34
-
35
-
36
-
37
-
38
-
39
-
40
-
41
-
42
-
43
-
44
-
45
-
46
-
47
-
48
-
49
-
50
-
51
-
52
-
53
-
54
-
55
-
56
-
57
-
58
-
59
-
60
-
61
-
62
-
63
-
 64
64 -
 65
65 -
 66
66 -
 67
67 -
 68
68 -
 69
69 -
 70
70 -
 71
71 -
 72
72 -
 73
73 -
 74
74 -
 75
75 -
 76
76 -
 77
77 -
 78
78 -
 79
79 -
 80
80 -
 81
81 -
 82
82 -
 83
83 -
 84
84 -
85
-
86
-
87
-
88
-
89
-
90
-
91
-
92
-
93
-
94
-
95
-
96
-
97
-
98
-
99
-
100
-
101
-
102
-
103
-
104
-
105
-
106
-
107
-
108
-
109
-
110
-
111
-
112
-
113
-
114
-
115
-
116
-
117
-
118
-
119
-
120
-
121
-
122
-
123
-
124
-
125
-
126
-
127
-
128
-
129
-
130
-
131
-
132
-
133
-
134
-
135
-
136
-
137
-
138
-
139
-
140
-
141
-
142
-
143
-
144
-
145
-
146
-
147
-
148
-
149
-
150
-
151
-
152
-
153
-
154
-
155
-
156
-
157
-
158
-
159
-
160
-
161
-
162
-
163
-
164
-
165
-
166
-
167
-
168
-
169
-
170
-
171
-
172
-
173
-
174
-
175
-
176
-
177
-
178
-
179
-
180
-
181
-
182
-
183
-
184
-
185
-
186
-
187
-
188
-
189
-
190
-
191
-
192
-
193
-
194
-
195
-
196
-
197
-
198
-
199
-
200
-
201
-
202
-
203
-
204
-
205
-
206
-
207
-
208
-
209
-
210
-
211
-
212
-
213
-
214
-
215
-
216
-
217
-
218
-
219
-
220
-
221
-
222
-
223
-
224
-
225
-
226
-
227
-
228
-
229
-
230
-
231
-
232
-
233
-
234
-
235
-
236
-
237
-
238
-
239
-
240
-
241
-
242
-
243
-
244
-
245
-
246
-
247
-
248
 |
 |
74
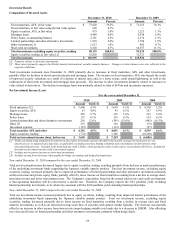
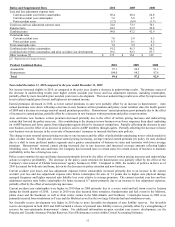
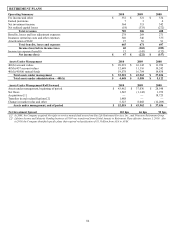
Year ended December 31, 2009 compared to the year ended December 31, 2008
Net income increased significantly in 2009, compared to 2008, driven by an increase in underwriting results coupled with improvements
in net realized capital losses. Underwriting results increased primarily due to lower losses and loss adjustment expenses for the current
accident year before catastrophes, lower current accident year catastrophe losses, and more favorable prior accident year development,
partially offset by decreases in earned premiums.
Earned premiums decreased in 2009, in nearly all lines of businesses. The decrease was primarily due to lower earned audit premium
on workers’ compensation business and the effect of non-renewals outpacing new business over the last two years for package business
and commercial auto. Property earned premiums decreased, primarily due to the sale of the Company’ s core excess and surplus lines
property business. For additional information on this sale, see Note 20 of the Notes to Consolidated Financial Statements.
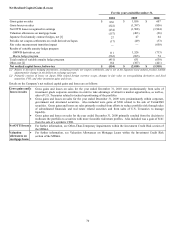
New business written premium increased, primarily driven by the increase in workers’ compensation and package business, partially
offset by a decrease in new business for professional liability, marine, general liability and commercial auto. Despite continued pricing
competition, the Company has increased new business for workers’ compensation by targeting business in selected industries and
regions of the country where attractive new business opportunities remain. For standard commercial lines, earned pricing decreased,
primarily driven by decreases in workers’ compensation, commercial auto, general liability, property and marine, partially offset by an
increase in package business. The earned pricing changes were primarily a reflection of written pricing changes over the last two years.
A number of carriers have continued to compete aggressively on price, particularly on larger accounts. In addition to the effect of
written pricing decreases in workers’ compensation, average premium per policy has declined due to a reduction in the payrolls of
workers’ compensation insureds and the effect of declining endorsements.
Also, for standard commercial lines, policy count retention decreased slightly as the effects of the downturn in the economy caused
business closures and increased shopping of policies by businesses seeking lower premiums. The number of policies in-force increased
in 2009, as the growth in policies in-force does not correspond directly with the change in earned premiums due to the effect of changes
in earned pricing and changes in the average premium per policy.
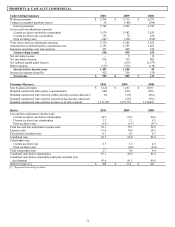
Current accident year losses and loss adjustment expenses before catastrophes decreased, primarily due to a decrease in earned
premium, partially offset by a slight increase in the current accident year loss and loss adjustment expense ratio before catastrophes.
The increase in the ratio was primarily due to a higher loss and loss adjustment expense ratio on workers’ compensation, package
business and general liability, partially offset by lower non-catastrophe losses on property and marine business, driven by favorable
claim frequency and severity. The higher loss and loss adjustment expense ratio on workers’ compensation and general liability
business was primarily due to the effects of renewal earned pricing decreases in excess of loss cost change.
Current accident year catastrophe losses decreased as losses in 2008 from hurricane Ike and tornadoes and thunderstorms in the South
and Midwest were higher than losses in 2009. Losses in 2009 were primarily incurred from ice storms, windstorms, and tornadoes
across Colorado, the Midwest and Southeast.
Net favorable prior accident year reserve development, in both periods, included reserve releases in the following: workers’
compensation, general liability, including umbrella and high hazard liability, professional liability and auto liability. Reserve
development in 2009 also included strengthening in both package business and fidelity and surety, and releases in uncollectible
reinsurance and catastrophes, while reserve development in 2008 also included strengthening in general liability, including product
liability and national accounts. For a discussion on prior accident year reserve development, see the Property and Casualty Insurance
Product Reserves, Net of Reinsurance section within Critical Accounting Estimates.
Insurance operating costs and expenses decreased primarily due to a $37 decrease in the estimated amount of dividends payable to
certain workers’ compensation policyholders and a decrease in TWIA assessments of $17, partially offset by increase in taxes, license
and fees of $23 and higher compensation-related costs. The increase in taxes, license and fees included, a $6 increase in the assessment
for a second injury fund and $9 reserve strengthening for other state funds and taxes. Amortization of deferred policy acquisition costs
decreased largely due to the decrease in earned premiums.
Net realized capital gains (losses) improved significantly in 2009. The improvements were driven primarily by lower impairments in
2009 compared to 2008. Net investment income decreased in 2009, primarily due to lower income on fixed maturities resulting from a
decline in average rates, partially offset by decreased losses on limited partnerships and other alternative investments. For additional
information, see the Investment Results section within Key Performance Measures and Ratios.
The effective tax rate, in both periods, differs from the U.S. Federal statutory rate. In 2009, this is primarily due to permanent
differences related to investments in tax exempt securities. In 2008, there was a net income tax benefit despite having pre-tax income
due to an income tax benefit on realized capital losses that was greater than the income tax expense on all other components of pre-tax
income. For further discussion, see Income Taxes within Note 13 of the Notes to Consolidated Financial Statements.