The Hartford 2010 Annual Report Download - page 140
Download and view the complete annual report
Please find page 140 of the 2010 The Hartford annual report below. You can navigate through the pages in the report by either clicking on the pages listed below, or by using the keyword search tool below to find specific information within the annual report.-
 1
1 -
2
-
3
-
4
-
5
-
6
-
7
-
8
-
9
-
10
-
11
-
12
-
13
-
14
-
15
-
16
-
17
-
18
-
19
-
20
-
21
-
22
-
23
-
24
-
25
-
26
-
27
-
28
-
29
-
30
-
31
-
32
-
33
-
34
-
35
-
36
-
37
-
38
-
39
-
40
-
41
-
42
-
43
-
44
-
45
-
46
-
47
-
48
-
49
-
50
-
51
-
52
-
53
-
54
-
55
-
56
-
57
-
58
-
59
-
60
-
61
-
62
-
63
-
64
-
65
-
66
-
67
-
68
-
69
-
70
-
71
-
72
-
73
-
74
-
75
-
76
-
77
-
78
-
79
-
80
-
81
-
82
-
83
-
84
-
85
-
86
-
87
-
88
-
89
-
90
-
91
-
92
-
93
-
94
-
95
-
96
-
97
-
98
-
99
-
100
-
101
-
102
-
103
-
104
-
105
-
106
-
107
-
108
-
109
-
110
-
111
-
112
-
113
-
114
-
115
-
116
-
117
-
118
-
119
-
120
-
121
-
122
-
123
-
124
-
125
-
126
-
127
-
128
-
129
-
 130
130 -
 131
131 -
 132
132 -
 133
133 -
 134
134 -
 135
135 -
 136
136 -
 137
137 -
 138
138 -
 139
139 -
 140
140 -
 141
141 -
 142
142 -
 143
143 -
 144
144 -
 145
145 -
 146
146 -
 147
147 -
 148
148 -
 149
149 -
 150
150 -
151
-
152
-
153
-
154
-
155
-
156
-
157
-
158
-
159
-
160
-
161
-
162
-
163
-
164
-
165
-
166
-
167
-
168
-
169
-
170
-
171
-
172
-
173
-
174
-
175
-
176
-
177
-
178
-
179
-
180
-
181
-
182
-
183
-
184
-
185
-
186
-
187
-
188
-
189
-
190
-
191
-
192
-
193
-
194
-
195
-
196
-
197
-
198
-
199
-
200
-
201
-
202
-
203
-
204
-
205
-
206
-
207
-
208
-
209
-
210
-
211
-
212
-
213
-
214
-
215
-
216
-
217
-
218
-
219
-
220
-
221
-
222
-
223
-
224
-
225
-
226
-
227
-
228
-
229
-
230
-
231
-
232
-
233
-
234
-
235
-
236
-
237
-
238
-
239
-
240
-
241
-
242
-
243
-
244
-
245
-
246
-
247
-
248
 |
 |

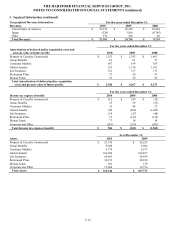
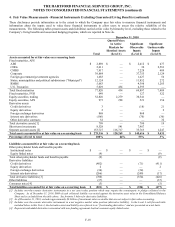
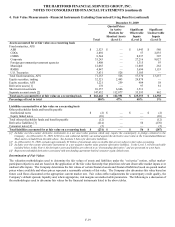
THE HARTFORD FINANCIAL SERVICES GROUP, INC.
NOTES TO CONSOLIDATED FINANCIAL STATEMENTS (continued)
F-12
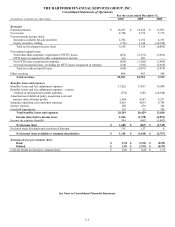
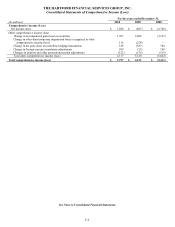
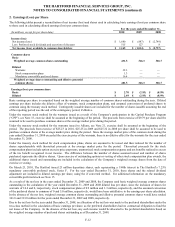
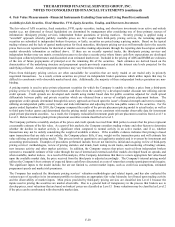
2. Earnings (Loss) per Share
The following tables present a reconciliation of net income (loss) and shares used in calculating basic earnings (loss) per common share
to those used in calculating diluted earnings (loss) per common share.
For the years ended December 31,
(In millions, except for per share data) 2010 2009 2008
Income (loss)
Net income (loss) $ 1,680 $ (887) $ (2,749)
Less: Preferred stock dividends and accretion of discount 515 127 8
Net income (loss) available to common shareholders $ 1,165 $ (1,014) $ (2,757)
Common shares
Basic
Weighted average common shares outstanding 431.5 346.3 306.7
Diluted
Warrants 32.3 — —
Stock compensation plans 1.3 — —
Mandatory convertible preferred shares 16.4 — —
Weighted average shares outstanding and dilutive potential
common shares 481.5 346.3 306.7
Earnings (loss) per common share
Basic $ 2.70 $ (2.93) $ (8.99)
Diluted $ 2.49 $ (2.93) $ (8.99)
Basic earnings per share is computed based on the weighted average number of common shares outstanding during the year. Diluted
earnings per share includes the dilutive effect of warrants, stock compensation plans, and assumed conversion of preferred shares to
common using the treasury stock method. Contingently issuable shares are included for the number of shares issuable assuming the end
of the reporting period was the end of the contingency period, if dilutive.
Under the treasury stock method for the warrants issued as a result of the Company’ s participation in the Capital Purchase Program
(“CPP”), see Note 15, exercise shall be assumed at the beginning of the period. The proceeds from exercise of $9.79 per share shall be
assumed to be used to purchase common shares at the average market price during the period.
Under the treasury stock method for the warrants issued to Allianz, see Note 21, exercise shall be assumed at the beginning of the
period. The proceeds from exercise of $25.23 in 2010, $25.25 in 2009 and $25.32 in 2008 per share shall be assumed to be used to
purchase common shares at the average market price during the period. Since the average market price of the common stock during the
year ended December 31, 2008 exceeded the exercise price of the warrants, there is no dilutive effect for the warrants for the year ended
December 31, 2008.
Under the treasury stock method for stock compensation plans, shares are assumed to be issued and then reduced for the number of
shares repurchaseable with theoretical proceeds at the average market price for the period. Theoretical proceeds for the stock
compensation plans include option exercise price payments, unamortized stock compensation expense and tax benefits realized in excess
of the tax benefit recognized in net income. The difference between the number of shares assumed issued and number of shares
purchased represents the dilutive shares. Upon exercise of outstanding options or vesting of other stock compensation plan awards, the
additional shares issued and outstanding are included in the calculation of the Company’ s weighted average shares from the date of
exercise or vesting.
On March 23, 2010, The Hartford issued 23 million depositary shares, each representing a 1/40th interest in The Hartford’ s 7.25%
mandatory convertible preferred stock, Series F. For the year ended December 31, 2010, these shares and the related dividend
adjustment are included in diluted earnings per share, using the if converted method. For additional information on the mandatory
convertible preferred stock see Note 15.
As a result of the net loss in the years ended December 31, 2009 and 2008, the Company used basic weighted average common shares
outstanding in the calculation of the year ended December 31, 2009 and 2008 diluted loss per share, since the inclusion of shares for
warrants of 14.6 and 0, respectively, stock compensation plans of 0.9 million and 1.3 million, respectively, and the assumed conversion
of the preferred shares to common of 0 and 5.0 million, respectively, would have been antidilutive to the earnings per share calculation.
In the absence of the net loss, weighted average common shares outstanding and dilutive potential common shares would have totaled
361.8 and 313.0 million for the years ended December 31, 2009 and 2008, respectively.
Due to the net loss for the year ended December 31, 2008, no allocation of the net loss was made to the preferred shareholders under the
two-class method in the calculation of basic earnings per share, as the preferred shareholders had no contractual obligation to fund the
net losses of the Company. In the absence of the net loss, any such income would be allocated to the preferred shareholders based on
the weighted average number of preferred shares outstanding as of December 31, 2008.