The Hartford 2010 Annual Report Download - page 172
Download and view the complete annual report
Please find page 172 of the 2010 The Hartford annual report below. You can navigate through the pages in the report by either clicking on the pages listed below, or by using the keyword search tool below to find specific information within the annual report.-
 1
1 -
2
-
3
-
4
-
5
-
6
-
7
-
8
-
9
-
10
-
11
-
12
-
13
-
14
-
15
-
16
-
17
-
18
-
19
-
20
-
21
-
22
-
23
-
24
-
25
-
26
-
27
-
28
-
29
-
30
-
31
-
32
-
33
-
34
-
35
-
36
-
37
-
38
-
39
-
40
-
41
-
42
-
43
-
44
-
45
-
46
-
47
-
48
-
49
-
50
-
51
-
52
-
53
-
54
-
55
-
56
-
57
-
58
-
59
-
60
-
61
-
62
-
63
-
64
-
65
-
66
-
67
-
68
-
69
-
70
-
71
-
72
-
73
-
74
-
75
-
76
-
77
-
78
-
79
-
80
-
81
-
82
-
83
-
84
-
85
-
86
-
87
-
88
-
89
-
90
-
91
-
92
-
93
-
94
-
95
-
96
-
97
-
98
-
99
-
100
-
101
-
102
-
103
-
104
-
105
-
106
-
107
-
108
-
109
-
110
-
111
-
112
-
113
-
114
-
115
-
116
-
117
-
118
-
119
-
120
-
121
-
122
-
123
-
124
-
125
-
126
-
127
-
128
-
129
-
130
-
131
-
132
-
133
-
134
-
135
-
136
-
137
-
138
-
139
-
140
-
141
-
142
-
143
-
144
-
145
-
146
-
147
-
148
-
149
-
150
-
151
-
152
-
153
-
154
-
155
-
156
-
157
-
158
-
159
-
160
-
161
-
 162
162 -
 163
163 -
 164
164 -
 165
165 -
 166
166 -
 167
167 -
 168
168 -
 169
169 -
 170
170 -
 171
171 -
 172
172 -
 173
173 -
 174
174 -
 175
175 -
 176
176 -
 177
177 -
 178
178 -
 179
179 -
 180
180 -
 181
181 -
 182
182 -
183
-
184
-
185
-
186
-
187
-
188
-
189
-
190
-
191
-
192
-
193
-
194
-
195
-
196
-
197
-
198
-
199
-
200
-
201
-
202
-
203
-
204
-
205
-
206
-
207
-
208
-
209
-
210
-
211
-
212
-
213
-
214
-
215
-
216
-
217
-
218
-
219
-
220
-
221
-
222
-
223
-
224
-
225
-
226
-
227
-
228
-
229
-
230
-
231
-
232
-
233
-
234
-
235
-
236
-
237
-
238
-
239
-
240
-
241
-
242
-
243
-
244
-
245
-
246
-
247
-
248
 |
 |

THE HARTFORD FINANCIAL SERVICES GROUP, INC.
NOTES TO CONSOLIDATED FINANCIAL STATEMENTS (continued)
F-44
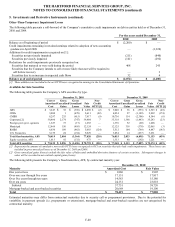
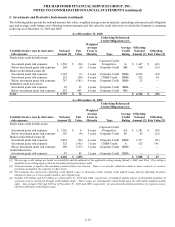
5. Investments and Derivative Instruments (continued)
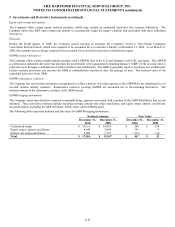
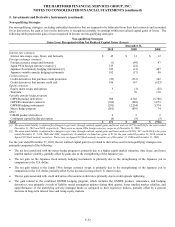
Consolidated VIEs
The following table presents the carrying value of assets and liabilities, and the maximum exposure to loss relating to the VIEs for
which the Company is the primary beneficiary. Creditors have no recourse against the Company in the event of default by these VIEs
nor does the Company have any implied or unfunded commitments to these VIEs. The Company’ s financial or other support provided
to these VIEs is limited to its investment management services and original investment. As a result of accounting guidance adopted on
January 1, 2010, certain CDO VIEs were consolidated in 2010 and are included in the following table, while in prior periods they were
reported in the Non-Consolidated VIEs table further below. For further information on the adoption, see Note 1.
December 31, 2010 December 31, 2009
Total
Assets
Total
Liabilities [1]
Maximum
Exposure
to Loss [2]
Total
Assets
Total
Liabilities [1]
Maximum
Exposure
to Loss [2]
CDOs [3] $ 729 $ 393 $ 289 $ 226 $ 32 $ 196
Limited partnerships 14 1 13 31 1 30
Other investments [3] — — — 111 20 87
Total $ 743 $ 394 $ 302 $ 368 $ 53 $ 313
[1] Included in other liabilities in the Company’s Consolidated Balance Sheets.
[2] The maximum exposure to loss represents the maximum loss amount that the Company could recognize as a reduction in net investment income or
as a realized capital loss and is the cost basis of the Company’s investment.
[3] Total assets included in fixed maturities, AFS, and fixed maturities, FVO, in the Company’s Consolidated Balance Sheets.
CDOs represent structured investment vehicles for which the Company has a controlling financial interest as it provides collateral
management services, earns a fee for those services and also holds investments in the securities issued by these vehicles. Limited
partnerships represent a hedge fund for which the Company holds a majority interest in the fund as an investment. Other investments
represent an investment trust for which the Company has a controlling financial interest as it provides investment management services,
earns a fee for those services and also holds investments in the securities issued by the trusts. During 2010, the Company liquidated this
investment trust.
Non-Consolidated VIEs
The following table presents the carrying value of assets and liabilities, and the maximum exposure to loss relating to significant VIEs
for which the Company is not the primary beneficiary. The Company has no implied or unfunded commitments to these VIEs.
December 31, 2010 December 31, 2009
Assets Liabilities
Maximum
Exposure
to Loss Assets Liabilities
Maximum
Exposure
to Loss
CDOs [1] $ — $ — $ — $ 262 $ — $ 273
Other [2] 32 32 4 36 36 5
Total $ 32 $ 32 $ 4 $ 298 $ 36 $ 278
[1] Maximum exposure to loss represents the Company’s investment in securities issued by CDOs at cost.
[2] Maximum exposure to loss represents issuance costs that were incurred to establish a contingent capital facility.
Other represents the Company’ s variable interest in a contingent capital facility (“facility”), which has been held for four years. For
further information on the facility, see Note 14. The Company does not have a controlling financial interest as it does not manage the
assets of the facility nor does it have the obligation to absorb losses or the right to receive benefits that could potentially be significant to
the facility, as the asset manager has significant variable interest in the vehicle. The Company’ s financial or other support provided to
the facility is limited to providing ongoing support to cover the facility’ s operating expenses.