The Hartford 2010 Annual Report Download - page 85
Download and view the complete annual report
Please find page 85 of the 2010 The Hartford annual report below. You can navigate through the pages in the report by either clicking on the pages listed below, or by using the keyword search tool below to find specific information within the annual report.-
 1
1 -
2
-
3
-
4
-
5
-
6
-
7
-
8
-
9
-
10
-
11
-
12
-
13
-
14
-
15
-
16
-
17
-
18
-
19
-
20
-
21
-
22
-
23
-
24
-
25
-
26
-
27
-
28
-
29
-
30
-
31
-
32
-
33
-
34
-
35
-
36
-
37
-
38
-
39
-
40
-
41
-
42
-
43
-
44
-
45
-
46
-
47
-
48
-
49
-
50
-
51
-
52
-
53
-
54
-
55
-
56
-
57
-
58
-
59
-
60
-
61
-
62
-
63
-
64
-
65
-
66
-
67
-
68
-
69
-
70
-
71
-
72
-
73
-
74
-
 75
75 -
 76
76 -
 77
77 -
 78
78 -
 79
79 -
 80
80 -
 81
81 -
 82
82 -
 83
83 -
 84
84 -
 85
85 -
 86
86 -
 87
87 -
 88
88 -
 89
89 -
 90
90 -
 91
91 -
 92
92 -
 93
93 -
 94
94 -
 95
95 -
96
-
97
-
98
-
99
-
100
-
101
-
102
-
103
-
104
-
105
-
106
-
107
-
108
-
109
-
110
-
111
-
112
-
113
-
114
-
115
-
116
-
117
-
118
-
119
-
120
-
121
-
122
-
123
-
124
-
125
-
126
-
127
-
128
-
129
-
130
-
131
-
132
-
133
-
134
-
135
-
136
-
137
-
138
-
139
-
140
-
141
-
142
-
143
-
144
-
145
-
146
-
147
-
148
-
149
-
150
-
151
-
152
-
153
-
154
-
155
-
156
-
157
-
158
-
159
-
160
-
161
-
162
-
163
-
164
-
165
-
166
-
167
-
168
-
169
-
170
-
171
-
172
-
173
-
174
-
175
-
176
-
177
-
178
-
179
-
180
-
181
-
182
-
183
-
184
-
185
-
186
-
187
-
188
-
189
-
190
-
191
-
192
-
193
-
194
-
195
-
196
-
197
-
198
-
199
-
200
-
201
-
202
-
203
-
204
-
205
-
206
-
207
-
208
-
209
-
210
-
211
-
212
-
213
-
214
-
215
-
216
-
217
-
218
-
219
-
220
-
221
-
222
-
223
-
224
-
225
-
226
-
227
-
228
-
229
-
230
-
231
-
232
-
233
-
234
-
235
-
236
-
237
-
238
-
239
-
240
-
241
-
242
-
243
-
244
-
245
-
246
-
247
-
248
 |
 |
85
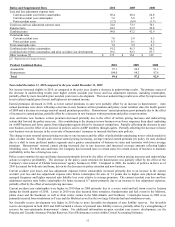
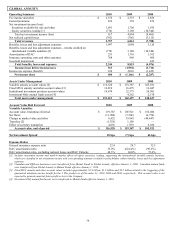
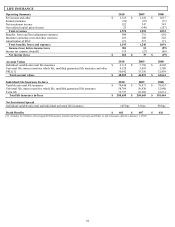
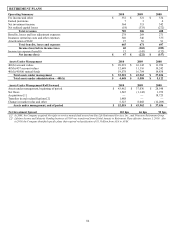
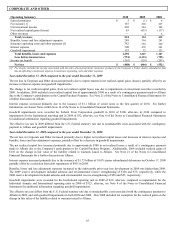
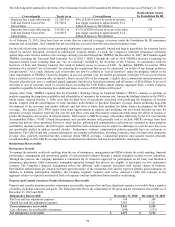
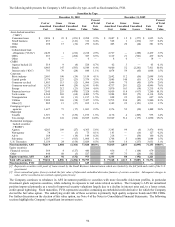
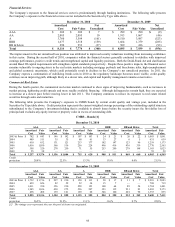
Year ended December 31, 2010 compared to the year ended December 31, 2009
Retirement Plans’ net income in 2010 compared to a net loss in 2009 primarily due to significant improvements in net realized capital
losses, as well as higher net investment income and improvements in the equity markets which resulted in a DAC Unlock benefit in
2010 as compared to a DAC Unlock charge in 2009 and continued market value appreciation in AUM which resulted in increased fee
income and other.
Net realized capital losses were lower in 2010 compared to 2009 due to lower losses from impairments, derivatives, and trading losses
compared to 2009.
Net investment income increased in 2010 compared to 2009 primarily due to the improved performance from limited partnerships and
other alternative investments and higher average general account invested assets compared to 2009. Correspondingly, the improvements
in performance on limited partnerships and other alternative investments drove an increase in the net investment spread of 39 bps,
partially offset by lower returns on fixed maturity securities. Net investment spread also improved due to lower crediting rates of 10
bps.
The DAC Unlock benefit was $18, after-tax, in 2010 as compared to a DAC Unlock charge of $56, after-tax, in 2009. The benefit in
2010 was primarily due to assumption changes based on actual experience and to a lesser extent from the market performance variance
to expectations for the year ended December 31, 2010, while 2009’ s charge was primarily the result assumption changes based on actual
experience and equity market performance significantly below expectations. The DAC Unlock primarily resulted in a decrease to
amortization of DAC. For further discussion of DAC Unlock see the Critical Accounting Estimates within the MD&A.
Fee income and other increased primarily due to increases in asset based fees on higher average account values resulting from
improvements in equity markets and increased net flows.
Retirement Plans’ effective tax rate differs from the statutory rate of 35% primarily due to permanent differences for the separate
account DRD. Income taxes include separate account DRD benefits of $18 in 2010 compared to $15 in 2009. For further discussion,
see Note 13 of the Notes to Consolidated Financial Statements.
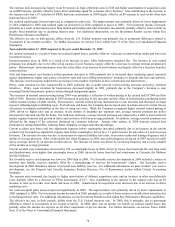
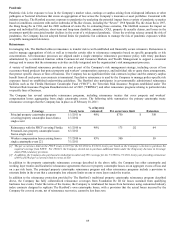
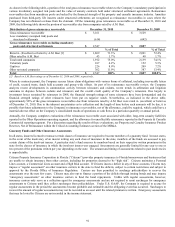
Year ended December 31, 2009 compared to the year ended December 31, 2008
Retirement Plans’ net loss increased due to an increase in net realized capital losses, lower net investment income, lower fee income and
other and insurance operating costs and other expenses, partially offset by lower amortization of DAC.
Net realized capital losses increased primarily as a result of realized losses of $56 on non-qualifying derivatives in 2009 compared with
$14 of gains in 2008 and mortgage valuation allowances of $38 in 2009, partially offset by OTTI impairment losses of $178 in 2009
compared with $243 in 2008.
Net investment income decreased primarily as a result of lower yields on fixed maturity investments, partially offset by an increase in
derivative income. Net investment spread’ s decline is attributable to lower fixed maturity returns of 34 bps and lower returns on limited
partnerships and other alternative investments of 3 bps, partially offset by a reduction in credited rates of 10 bps.
Fee income and other decreased primarily due to lower asset based fees on lower average account values. Despite equity market
improvements during the last nine months of 2009, account values did not return to early 2008 levels. Additionally, net flows declined
due to a few large case surrenders in 2009.
Insurance operating costs and other expenses increased primarily due to a full year of operating expenses associated with the businesses
acquired in 2008 and lower deferrable acquisition expenses due to low sales levels, partially offset by expense management initiatives.
The DAC Unlock charge was $56, after-tax, in 2009 as compared to a DAC Unlock charge of $49, after-tax, in 2008. The charges in
both periods primarily related to assumption changes based on actual experience and the variance in market performance compared to
expectations. The DAC Unlock primarily resulted in a decrease to amortization of DAC and an increase in net realized capital losses.
For further discussion of DAC Unlock see the Critical Accounting Estimates within the MD&A. Additionally, amortization of DAC
decreased as a result of lower gross profits in 2009 than in 2008.
Retirement Plans’ effective tax rate differs from the statutory rate of 35% primarily due to permanent differences for the separate
account DRD. Income taxes include separate account DRD benefits of $15 in 2009 compared to $32 in 2008. For further discussion,
see Note 13 of the Notes to Consolidated Financial Statements.