The Hartford 2010 Annual Report Download - page 173
Download and view the complete annual report
Please find page 173 of the 2010 The Hartford annual report below. You can navigate through the pages in the report by either clicking on the pages listed below, or by using the keyword search tool below to find specific information within the annual report.-
 1
1 -
2
-
3
-
4
-
5
-
6
-
7
-
8
-
9
-
10
-
11
-
12
-
13
-
14
-
15
-
16
-
17
-
18
-
19
-
20
-
21
-
22
-
23
-
24
-
25
-
26
-
27
-
28
-
29
-
30
-
31
-
32
-
33
-
34
-
35
-
36
-
37
-
38
-
39
-
40
-
41
-
42
-
43
-
44
-
45
-
46
-
47
-
48
-
49
-
50
-
51
-
52
-
53
-
54
-
55
-
56
-
57
-
58
-
59
-
60
-
61
-
62
-
63
-
64
-
65
-
66
-
67
-
68
-
69
-
70
-
71
-
72
-
73
-
74
-
75
-
76
-
77
-
78
-
79
-
80
-
81
-
82
-
83
-
84
-
85
-
86
-
87
-
88
-
89
-
90
-
91
-
92
-
93
-
94
-
95
-
96
-
97
-
98
-
99
-
100
-
101
-
102
-
103
-
104
-
105
-
106
-
107
-
108
-
109
-
110
-
111
-
112
-
113
-
114
-
115
-
116
-
117
-
118
-
119
-
120
-
121
-
122
-
123
-
124
-
125
-
126
-
127
-
128
-
129
-
130
-
131
-
132
-
133
-
134
-
135
-
136
-
137
-
138
-
139
-
140
-
141
-
142
-
143
-
144
-
145
-
146
-
147
-
148
-
149
-
150
-
151
-
152
-
153
-
154
-
155
-
156
-
157
-
158
-
159
-
160
-
161
-
162
-
 163
163 -
 164
164 -
 165
165 -
 166
166 -
 167
167 -
 168
168 -
 169
169 -
 170
170 -
 171
171 -
 172
172 -
 173
173 -
 174
174 -
 175
175 -
 176
176 -
 177
177 -
 178
178 -
 179
179 -
 180
180 -
 181
181 -
 182
182 -
 183
183 -
184
-
185
-
186
-
187
-
188
-
189
-
190
-
191
-
192
-
193
-
194
-
195
-
196
-
197
-
198
-
199
-
200
-
201
-
202
-
203
-
204
-
205
-
206
-
207
-
208
-
209
-
210
-
211
-
212
-
213
-
214
-
215
-
216
-
217
-
218
-
219
-
220
-
221
-
222
-
223
-
224
-
225
-
226
-
227
-
228
-
229
-
230
-
231
-
232
-
233
-
234
-
235
-
236
-
237
-
238
-
239
-
240
-
241
-
242
-
243
-
244
-
245
-
246
-
247
-
248
 |
 |
THE HARTFORD FINANCIAL SERVICES GROUP, INC.
NOTES TO CONSOLIDATED FINANCIAL STATEMENTS (continued)
F-45
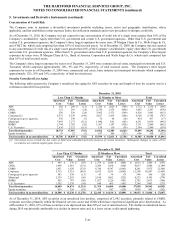
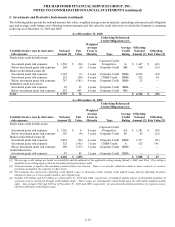
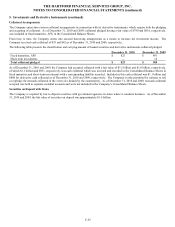
5. Investments and Derivative Instruments (continued)
In addition, the Company, through normal investment activities, makes passive investments in structured securities issued by VIEs for
which the Company is not the manager which are included in ABS, CDOs, CMBS and RMBS in the Available-for-Sale Securities table
and fixed maturities, FVO, in the Company’ s Consolidated Balance Sheets. The Company has not provided financial or other support
with respect to these investments other than its original investment. For these investments, the Company determined it is not the
primary beneficiary due to the relative size of the Company’ s investment in comparison to the principal amount of the structured
securities issued by the VIEs, the level of credit subordination which reduces the Company’ s obligation to absorb losses or right to
receive benefits and the Company’ s inability to direct the activities that most significantly impact the economic performance of the
VIEs. The Company’ s maximum exposure to loss on these investments is limited to the amount of the Company’ s investment.
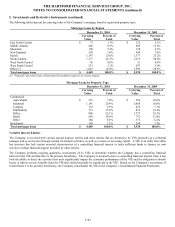
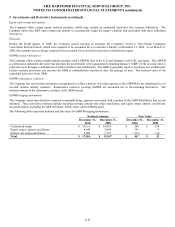
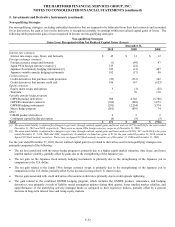
Equity Method Investments
The Company has investments in limited partnerships and other alternative investments which include hedge funds, mortgage and real
estate funds, mezzanine debt funds, and private equity and other funds (collectively, “limited partnerships”). These investments are
accounted for under the equity method and the Company’ s maximum exposure to loss as of December 31, 2010 is limited to the total
carrying value of $1.9 billion. In addition, the Company has outstanding commitments totaling approximately $693, to fund limited
partnership and other alternative investments as of December 31, 2010. The Company’ s investments in limited partnerships are
generally of a passive nature in that the Company does not take an active role in the management of the limited partnerships. In 2009,
aggregate investment income (losses) from limited partnerships and other alternative investments exceeded 10% of the Company’ s pre-
tax consolidated net income. Accordingly, the Company is disclosing aggregated summarized financial data for the Company’ s limited
partnership investments. This aggregated summarized financial data does not represent the Company’ s proportionate share of limited
partnership assets or earnings. Aggregate total assets of the limited partnerships in which the Company invested totaled $93.9 billion
and $80.7 billion as of December 31, 2010 and 2009, respectively. Aggregate total liabilities of the limited partnerships in which the
Company invested totaled $22.3 billion and $24.6 billion as of December 31, 2010 and 2009, respectively. Aggregate net investment
income (loss) of the limited partnerships in which the Company invested totaled $857, $(688) and $(228) for the periods ended
December 31, 2010, 2009 and 2008, respectively. Aggregate net income (loss) of the limited partnerships in which the Company
invested totaled $10.3 billion, $(9.1) billion and $(19.7) billion for the periods ended December 31, 2010, 2009 and 2008, respectively.
As of, and for the period ended, December 31, 2010, the aggregated summarized financial data reflects the latest available financial
information.
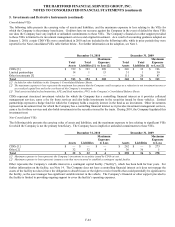
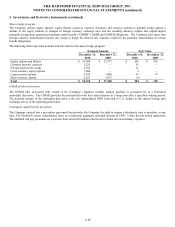
Derivative Instruments
The Company utilizes a variety of over-the-counter and exchange traded derivative instruments as a part of its overall risk management
strategy, as well as to enter into replication transactions. Derivative instruments are used to manage risk associated with interest rate,
equity market, credit spread, issuer default, price, and currency exchange rate risk or volatility. Replication transactions are used as an
economical means to synthetically replicate the characteristics and performance of assets that would otherwise be permissible
investments under the Company’ s investment policies. The Company also purchases and issues financial instruments and products that
either are accounted for as free-standing derivatives, such as certain reinsurance contracts, or may contain features that are deemed to be
embedded derivative instruments, such as the GMWB rider included with certain variable annuity products.
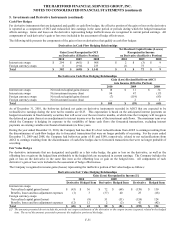
Cash flow hedges
Interest rate swaps
Interest rate swaps are primarily used to convert interest receipts on floating-rate fixed maturity securities or interest payments on
floating-rate guaranteed investment contracts to fixed rates. These derivatives are predominantly used to better match cash receipts
from assets with cash disbursements required to fund liabilities.
The Company also enters into forward starting swap agreements to hedge the interest rate exposure related to the purchase of fixed-rate
securities. These derivatives are primarily structured to hedge interest rate risk inherent in the assumptions used to price certain
liabilities.
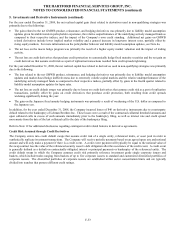
Foreign currency swaps
Foreign currency swaps are used to convert foreign currency-denominated cash flows related to certain investment receipts and liability
payments to U.S. dollars in order to minimize cash flow fluctuations due to changes in currency rates.
Forward rate agreements
Forward rate agreements may be used to convert interest receipts on floating-rate securities to fixed rates. These derivatives are used to
lock in the forward interest rate curve and reduce income volatility that results from changes in interest rates. As of December 31, 2010,
the Company does not have any forward rate agreements.