The Hartford 2010 Annual Report Download - page 151
Download and view the complete annual report
Please find page 151 of the 2010 The Hartford annual report below. You can navigate through the pages in the report by either clicking on the pages listed below, or by using the keyword search tool below to find specific information within the annual report.-
 1
1 -
2
-
3
-
4
-
5
-
6
-
7
-
8
-
9
-
10
-
11
-
12
-
13
-
14
-
15
-
16
-
17
-
18
-
19
-
20
-
21
-
22
-
23
-
24
-
25
-
26
-
27
-
28
-
29
-
30
-
31
-
32
-
33
-
34
-
35
-
36
-
37
-
38
-
39
-
40
-
41
-
42
-
43
-
44
-
45
-
46
-
47
-
48
-
49
-
50
-
51
-
52
-
53
-
54
-
55
-
56
-
57
-
58
-
59
-
60
-
61
-
62
-
63
-
64
-
65
-
66
-
67
-
68
-
69
-
70
-
71
-
72
-
73
-
74
-
75
-
76
-
77
-
78
-
79
-
80
-
81
-
82
-
83
-
84
-
85
-
86
-
87
-
88
-
89
-
90
-
91
-
92
-
93
-
94
-
95
-
96
-
97
-
98
-
99
-
100
-
101
-
102
-
103
-
104
-
105
-
106
-
107
-
108
-
109
-
110
-
111
-
112
-
113
-
114
-
115
-
116
-
117
-
118
-
119
-
120
-
121
-
122
-
123
-
124
-
125
-
126
-
127
-
128
-
129
-
130
-
131
-
132
-
133
-
134
-
135
-
136
-
137
-
138
-
139
-
140
-
 141
141 -
 142
142 -
 143
143 -
 144
144 -
 145
145 -
 146
146 -
 147
147 -
 148
148 -
 149
149 -
 150
150 -
 151
151 -
 152
152 -
 153
153 -
 154
154 -
 155
155 -
 156
156 -
 157
157 -
 158
158 -
 159
159 -
 160
160 -
 161
161 -
162
-
163
-
164
-
165
-
166
-
167
-
168
-
169
-
170
-
171
-
172
-
173
-
174
-
175
-
176
-
177
-
178
-
179
-
180
-
181
-
182
-
183
-
184
-
185
-
186
-
187
-
188
-
189
-
190
-
191
-
192
-
193
-
194
-
195
-
196
-
197
-
198
-
199
-
200
-
201
-
202
-
203
-
204
-
205
-
206
-
207
-
208
-
209
-
210
-
211
-
212
-
213
-
214
-
215
-
216
-
217
-
218
-
219
-
220
-
221
-
222
-
223
-
224
-
225
-
226
-
227
-
228
-
229
-
230
-
231
-
232
-
233
-
234
-
235
-
236
-
237
-
238
-
239
-
240
-
241
-
242
-
243
-
244
-
245
-
246
-
247
-
248
 |
 |

THE HARTFORD FINANCIAL SERVICES GROUP, INC.
NOTES TO CONSOLIDATED FINANCIAL STATEMENTS (continued)
F-23
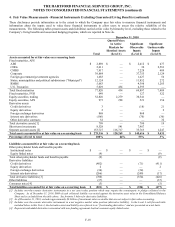
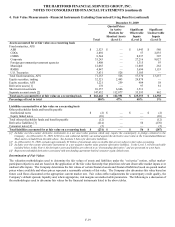
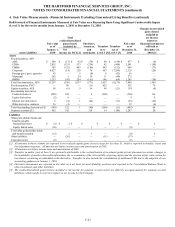
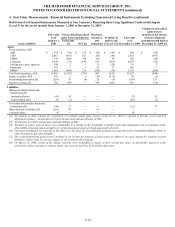
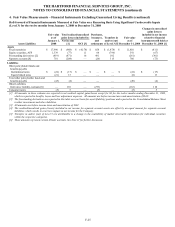
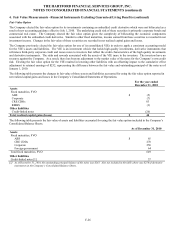
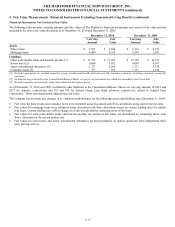
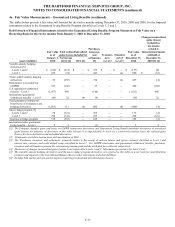
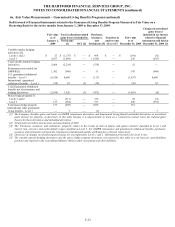
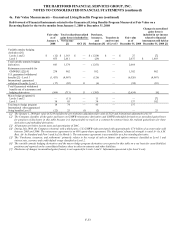
4. Fair Value Measurements –Financial Instruments Excluding Guaranteed Living Benefits (continued)
Roll-forward of Financial Instruments Measured at Fair Value on a Recurring Basis Using Significant Unobservable Inputs
(Level 3) for the twelve months from January 1, 2010 to December 31, 2010
Changes in unrealized
gains (losses)
included in
Total net income
realized/unrealized related to
Fair value gains (losses) Purchases, Fair value financial instruments
as of included in: issuances, Transfers Transfers as of still held at
January 1, Net and in to out of December 31, December 31,
Asset (Liability) 2010 income [1] OCI [2] settlements Level 3 [3] Level 3 [3] 2010 2010 [1]
Assets
Fixed maturities, AFS
ABS $ 580 $ (17) $ 92 $ (74) $ 40 $ (144) $ 477 $ (8)
CDOs 2,835 (151) 533 (234) 42 (444) 2,581 (158)
CMBS 307 (132) 409 (186) 443 (152) 689 (73)
Corporate 8,027 (14) 320 78 967 (7,249) 2,129 (24)
Foreign govt./govt. agencies 93 — 5 (8) 8 (42) 56 —
Municipal 262 1 24 14 11 (40) 272 —
RMBS 1,153 (43) 254 (161) 146 (64) 1,285 (38)
Total fixed maturities, AFS 13,257 (356) 1,637 (571) 1,657 (8,135) 7,489 (301)
Fixed maturities, FVO –– 80 — (11) 453 — 522 76
Equity securities, AFS 58 (6) 9 16 98 (21) 154 (8)
Freestanding derivatives
Credit derivatives (228) 124 — 4 (290)
— (390) 116
Equity derivatives (2) 6 — — — — 4 6
Interest rate derivatives 5 (4) 1 (44) — (11) (53) (24)
Other derivative contracts 36 (4) — — — — 32 (4)
Total freestanding derivatives [4] (189) 122 1 (40) (290) (11) (407) 94
Separate accounts [5] 962 142 — 314 14 (185) 1,247 20
Liabilities
Other policyholder funds and
benefits payable
Institutional notes $ (2) $ 2 $ $ $ $ $ — $ 2
Equity linked notes (10) — — 1 — — (9) —
Total other policyholder funds
and benefits payable
(12) 2 — 1 — — (9) 2
Other liabilities — (26) — — (11) — (37) —
Consumer notes (5) — — — — — (5) —
[1] All amounts in these columns are reported in net realized capital gains (losses) except for less than $1, which is reported in benefits, losses and
loss adjustment expenses. All amounts are before income taxes and amortization of DAC.
[2] All amounts are before income taxes and amortization of DAC.
[3] Transfers in and/or (out) of Level 3 are primarily attributable to the reclassification of investment grade private placement securities, changes in
the availability of market observable information, the re-evaluation of the observability of pricing inputs and the election of fair value option for
investments containing an embedded credit derivative. Transfers in also include the consolidation of additional VIEs due to the adoption of new
accounting guidance on January 1, 2010.
[4] Derivative instruments are reported in this table on a net basis for asset/(liability) positions and reported in the Consolidated Balance Sheet in
other investments and other liabilities.
[5] The realized/unrealized gains (losses) included in net income for separate account assets are offset by an equal amount for separate account
liabilities, which results in a net zero impact on net income for the Company.