The Hartford 2010 Annual Report Download - page 159
Download and view the complete annual report
Please find page 159 of the 2010 The Hartford annual report below. You can navigate through the pages in the report by either clicking on the pages listed below, or by using the keyword search tool below to find specific information within the annual report.-
 1
1 -
2
-
3
-
4
-
5
-
6
-
7
-
8
-
9
-
10
-
11
-
12
-
13
-
14
-
15
-
16
-
17
-
18
-
19
-
20
-
21
-
22
-
23
-
24
-
25
-
26
-
27
-
28
-
29
-
30
-
31
-
32
-
33
-
34
-
35
-
36
-
37
-
38
-
39
-
40
-
41
-
42
-
43
-
44
-
45
-
46
-
47
-
48
-
49
-
50
-
51
-
52
-
53
-
54
-
55
-
56
-
57
-
58
-
59
-
60
-
61
-
62
-
63
-
64
-
65
-
66
-
67
-
68
-
69
-
70
-
71
-
72
-
73
-
74
-
75
-
76
-
77
-
78
-
79
-
80
-
81
-
82
-
83
-
84
-
85
-
86
-
87
-
88
-
89
-
90
-
91
-
92
-
93
-
94
-
95
-
96
-
97
-
98
-
99
-
100
-
101
-
102
-
103
-
104
-
105
-
106
-
107
-
108
-
109
-
110
-
111
-
112
-
113
-
114
-
115
-
116
-
117
-
118
-
119
-
120
-
121
-
122
-
123
-
124
-
125
-
126
-
127
-
128
-
129
-
130
-
131
-
132
-
133
-
134
-
135
-
136
-
137
-
138
-
139
-
140
-
141
-
142
-
143
-
144
-
145
-
146
-
147
-
148
-
 149
149 -
 150
150 -
 151
151 -
 152
152 -
 153
153 -
 154
154 -
 155
155 -
 156
156 -
 157
157 -
 158
158 -
 159
159 -
 160
160 -
 161
161 -
 162
162 -
 163
163 -
 164
164 -
 165
165 -
 166
166 -
 167
167 -
 168
168 -
 169
169 -
170
-
171
-
172
-
173
-
174
-
175
-
176
-
177
-
178
-
179
-
180
-
181
-
182
-
183
-
184
-
185
-
186
-
187
-
188
-
189
-
190
-
191
-
192
-
193
-
194
-
195
-
196
-
197
-
198
-
199
-
200
-
201
-
202
-
203
-
204
-
205
-
206
-
207
-
208
-
209
-
210
-
211
-
212
-
213
-
214
-
215
-
216
-
217
-
218
-
219
-
220
-
221
-
222
-
223
-
224
-
225
-
226
-
227
-
228
-
229
-
230
-
231
-
232
-
233
-
234
-
235
-
236
-
237
-
238
-
239
-
240
-
241
-
242
-
243
-
244
-
245
-
246
-
247
-
248
 |
 |

THE HARTFORD FINANCIAL SERVICES GROUP, INC.
NOTES TO CONSOLIDATED FINANCIAL STATEMENTS (continued)
F-31
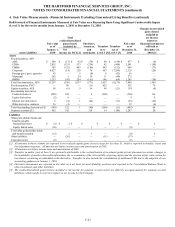
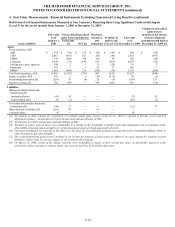
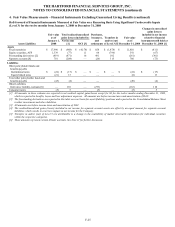
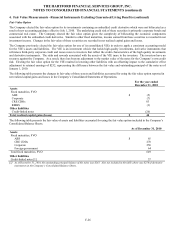
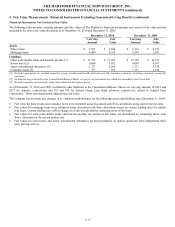
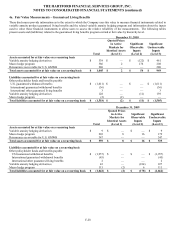
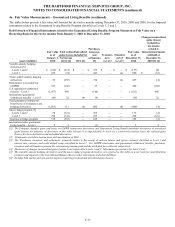
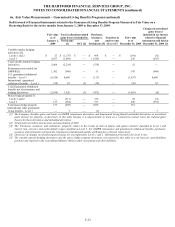
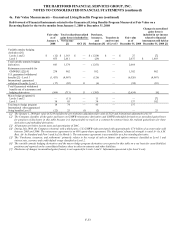
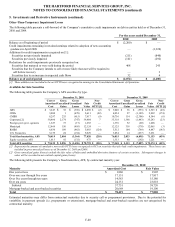
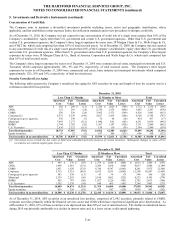
4a. Fair Value Measurements – Guaranteed Living Benefits (continued)
The tables below provide a fair value roll forward for the twelve months ending December 31, 2010, 2009 and 2008, for the financial
instruments related to the Guaranteed Living Benefits Program classified as Levels 1, 2 and 3.
Roll-forward of Financial Instruments related to the Guaranteed Living Benefits Program Measured at Fair Value on a
Recurring Basis for the twelve months from January 1, 2010 to December 31, 2010
Changes in unrealize
d
gains (losses)
included in
net income
Purchases, related to
Fair value Total realized/unrealized issuances, Fair value financial instruments
as of gains (losses) included in: and Transfers Transfers as of still held at
Asset (Liability)
January 1,
2010
Net income
[1] [2] [6] OCI [2]
settlements
[3]
in to
Level 3
out of
Level 3
December 31,
2010
December 31,
2010 [1] [2]
Variable annuity hedging
derivatives [5]
Levels 1 and 2 $ (184) $ (221) $ — $ 272 $ — $ — $ (133) [4]
Level 3 236 (74) — 442 — (4) 600 $ (61)
Total variable annuity hedging
derivatives 52 (295) — 714 — (4) 467 [4]
Reinsurance recoverable for
GMWB 347 (102) — 35 — — 280 (102)
U.S. guaranteed withdrawal
benefits – Level 3 (1,957) 486 — (140) — — (1,611) 486
International guaranteed
withdrawal benefits – Level 3 (45) 22 (4) (9) — — (36) 22
Total guaranteed withdrawal
benefits net of reinsurance and
hedging derivatives (1,603) 111 (4) 600 — (4) (900) [4]
Macro hedge program [5]
Levels 1 and 2 28 (221) — 369 — — 176 [4]
Level 3 290 (341) — 259 — — 208 (321)
Total macro hedge program 318 (562) — 628 — — 384 [4]
International other guaranteed
living benefits – Level 3 2 4 — (3) — — 3 4
[1] The Company classifies gains and losses on GMWB reinsurance derivatives and Guaranteed Living Benefit embedded derivatives as unrealized
gains (losses) for purposes of disclosure in this table because it is impracticable to track on a contract-by-contract basis the realized gains
(losses) for these derivatives and embedded derivatives.
[2] All amounts are before income taxes and amortization of DAC.
[3] The ‘Purchases, issuances, and settlements’ primarily relates to the receipt of cash on futures and option contracts classified as Level 1 and
interest rate, currency and credit default swaps classified as Level 2. For GMWB reinsurance and guaranteed withdrawal benefits, purchases,
issuances and settlements represent the reinsurance premium paid and the attributed fees collected, respectively.
[4] Disclosure of changes in unrealized gains (losses) is not required for Levels 1 and 2. Information presented is for Level 3 only.
[5] The variable annuity hedging derivatives and the macro hedge program derivatives are reported in this table on a net basis for asset/(liability)
positions and reported in the Consolidated Balance Sheet in other investments and other liabilities.
[6] Includes both market and non-market impacts in deriving realized and unrealized gains (losses).