The Hartford 2010 Annual Report Download - page 81
Download and view the complete annual report
Please find page 81 of the 2010 The Hartford annual report below. You can navigate through the pages in the report by either clicking on the pages listed below, or by using the keyword search tool below to find specific information within the annual report.-
 1
1 -
2
-
3
-
4
-
5
-
6
-
7
-
8
-
9
-
10
-
11
-
12
-
13
-
14
-
15
-
16
-
17
-
18
-
19
-
20
-
21
-
22
-
23
-
24
-
25
-
26
-
27
-
28
-
29
-
30
-
31
-
32
-
33
-
34
-
35
-
36
-
37
-
38
-
39
-
40
-
41
-
42
-
43
-
44
-
45
-
46
-
47
-
48
-
49
-
50
-
51
-
52
-
53
-
54
-
55
-
56
-
57
-
58
-
59
-
60
-
61
-
62
-
63
-
64
-
65
-
66
-
67
-
68
-
69
-
70
-
 71
71 -
 72
72 -
 73
73 -
 74
74 -
 75
75 -
 76
76 -
 77
77 -
 78
78 -
 79
79 -
 80
80 -
 81
81 -
 82
82 -
 83
83 -
 84
84 -
 85
85 -
 86
86 -
 87
87 -
 88
88 -
 89
89 -
 90
90 -
 91
91 -
92
-
93
-
94
-
95
-
96
-
97
-
98
-
99
-
100
-
101
-
102
-
103
-
104
-
105
-
106
-
107
-
108
-
109
-
110
-
111
-
112
-
113
-
114
-
115
-
116
-
117
-
118
-
119
-
120
-
121
-
122
-
123
-
124
-
125
-
126
-
127
-
128
-
129
-
130
-
131
-
132
-
133
-
134
-
135
-
136
-
137
-
138
-
139
-
140
-
141
-
142
-
143
-
144
-
145
-
146
-
147
-
148
-
149
-
150
-
151
-
152
-
153
-
154
-
155
-
156
-
157
-
158
-
159
-
160
-
161
-
162
-
163
-
164
-
165
-
166
-
167
-
168
-
169
-
170
-
171
-
172
-
173
-
174
-
175
-
176
-
177
-
178
-
179
-
180
-
181
-
182
-
183
-
184
-
185
-
186
-
187
-
188
-
189
-
190
-
191
-
192
-
193
-
194
-
195
-
196
-
197
-
198
-
199
-
200
-
201
-
202
-
203
-
204
-
205
-
206
-
207
-
208
-
209
-
210
-
211
-
212
-
213
-
214
-
215
-
216
-
217
-
218
-
219
-
220
-
221
-
222
-
223
-
224
-
225
-
226
-
227
-
228
-
229
-
230
-
231
-
232
-
233
-
234
-
235
-
236
-
237
-
238
-
239
-
240
-
241
-
242
-
243
-
244
-
245
-
246
-
247
-
248
 |
 |
81
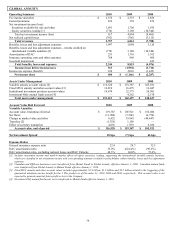
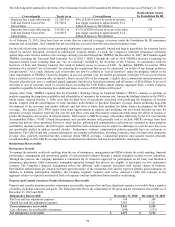
Year ended December 31, 2009 compared to the year ended December 31, 2008
Net loss improved in 2009 as compared to 2008 primarily due to lower net realized capital losses, goodwill impairment in 2008 and
lower insurance operating and other expenses, partially offset by decreases in fee income and other, earned premiums and net
investment income on securities available-for-sale and other, as well as a higher Unlock charge in 2009.
The net realized capital losses declined significantly in 2009 primarily due to gains of $631 on the variable annuity hedging program
compared to losses of $639 in 2008, realized losses recorded in 2008 of $650 related to the fair value measurement transition impact,
and lower impairment losses in 2009 compared to 2008. For further discussion on these results see Investment Results, Net Realized
Capital Gains (Losses) within Key Performance Measures and Ratios of the MD&A.
Insurance operating costs and other expenses have decreased as compared to 2008 as a result of lower asset based trail commissions due
to equity market declines, as well as management’ s active efforts to reduce operating expenses including the restructuring of
international operations. These efforts have also resulted in a decline in the general insurance expense ratio.
Fee income and other decreased in 2009 primarily due to a decline in average account values of variable annuities driven by significant
declines in market value during 2008, continued net outflows in 2009 and the decision in the second quarter of 2009 to suspend new
sales in Japan and European operations.
Earned premiums decreased as ratings downgrades reduced payout annuity sales, which was offset by a corresponding decrease in
benefits, losses, and loss adjustment expenses.
Net investment income declined primarily in institutional products due to lower income on fixed maturities resulting from a decline in
average interest rates on fixed maturity investments, as well as increased average assets held in short-term investment pools used to fund
the calls and buyback strategy and increased partnership losses. The declines in the institutional products net investment income were
partially offset by a corresponding decrease in interest credited on liabilities reported in benefits, losses, and loss adjustment expenses.
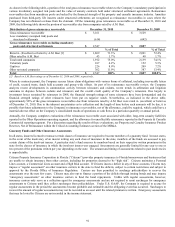
Net investment spread declined in 2009 compared to 2008 primarily due to the decrease in earnings on fixed maturities, including the
impact of interest rate hedges. Partnership earnings and other investing activities also declined lowering total spread by 7 bps. The
decline in fixed maturity returns was primarily related to a higher percentage of fixed maturities being held in short-term investments
and an overall decline in interest rates. Partially offsetting these declines in spread were decreases in crediting rates.
The DAC amortization ratio, excluding net realized capital losses and DAC Unlocks, improved due to lower gross profits driven by
decreases in equity market in 2008, and lower returns on limited partnerships and other alternative investments.
Global Annuity’ s effective tax rate differs from the statutory rate of 35% primarily due to permanent differences for the separate
account DRD on U.S. annuity products, as well as varying tax rates by country, and the valuation allowance on deferred tax benefits
related to certain realized losses on securities that back certain institutional investment products. Income taxes include separate account
DRD benefits of $142 in 2009 compared to $130 in 2008. For further discussion, see Note 13 of the Notes to Consolidated Financial
Statements.