The Hartford 2010 Annual Report Download - page 218
Download and view the complete annual report
Please find page 218 of the 2010 The Hartford annual report below. You can navigate through the pages in the report by either clicking on the pages listed below, or by using the keyword search tool below to find specific information within the annual report.-
 1
1 -
2
-
3
-
4
-
5
-
6
-
7
-
8
-
9
-
10
-
11
-
12
-
13
-
14
-
15
-
16
-
17
-
18
-
19
-
20
-
21
-
22
-
23
-
24
-
25
-
26
-
27
-
28
-
29
-
30
-
31
-
32
-
33
-
34
-
35
-
36
-
37
-
38
-
39
-
40
-
41
-
42
-
43
-
44
-
45
-
46
-
47
-
48
-
49
-
50
-
51
-
52
-
53
-
54
-
55
-
56
-
57
-
58
-
59
-
60
-
61
-
62
-
63
-
64
-
65
-
66
-
67
-
68
-
69
-
70
-
71
-
72
-
73
-
74
-
75
-
76
-
77
-
78
-
79
-
80
-
81
-
82
-
83
-
84
-
85
-
86
-
87
-
88
-
89
-
90
-
91
-
92
-
93
-
94
-
95
-
96
-
97
-
98
-
99
-
100
-
101
-
102
-
103
-
104
-
105
-
106
-
107
-
108
-
109
-
110
-
111
-
112
-
113
-
114
-
115
-
116
-
117
-
118
-
119
-
120
-
121
-
122
-
123
-
124
-
125
-
126
-
127
-
128
-
129
-
130
-
131
-
132
-
133
-
134
-
135
-
136
-
137
-
138
-
139
-
140
-
141
-
142
-
143
-
144
-
145
-
146
-
147
-
148
-
149
-
150
-
151
-
152
-
153
-
154
-
155
-
156
-
157
-
158
-
159
-
160
-
161
-
162
-
163
-
164
-
165
-
166
-
167
-
168
-
169
-
170
-
171
-
172
-
173
-
174
-
175
-
176
-
177
-
178
-
179
-
180
-
181
-
182
-
183
-
184
-
185
-
186
-
187
-
188
-
189
-
190
-
191
-
192
-
193
-
194
-
195
-
196
-
197
-
198
-
199
-
200
-
201
-
202
-
203
-
204
-
205
-
206
-
207
-
 208
208 -
 209
209 -
 210
210 -
 211
211 -
 212
212 -
 213
213 -
 214
214 -
 215
215 -
 216
216 -
 217
217 -
 218
218 -
 219
219 -
 220
220 -
 221
221 -
 222
222 -
 223
223 -
 224
224 -
 225
225 -
 226
226 -
 227
227 -
 228
228 -
229
-
230
-
231
-
232
-
233
-
234
-
235
-
236
-
237
-
238
-
239
-
240
-
241
-
242
-
243
-
244
-
245
-
246
-
247
-
248
 |
 |

THE HARTFORD FINANCIAL SERVICES GROUP, INC.
NOTES TO CONSOLIDATED FINANCIAL STATEMENTS (continued)
F-90
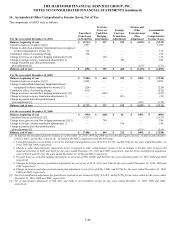
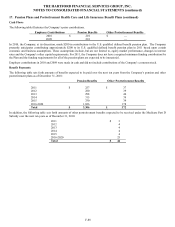
18. Stock Compensation Plans (continued)
The valuation model incorporates ranges of assumptions for inputs, and therefore, those ranges are disclosed below. The term structure
of volatility is generally constructed utilizing implied volatilities from exchange-traded options on the Company’ s stock, historical
volatility of the Company’ s stock and other factors. The Company uses historical data to estimate option exercise and employee
termination within the valuation model, and accommodates variations in employee preference and risk-tolerance by segregating the
grantee pool into a series of behavioral cohorts and conducting a fair valuation for each cohort individually. The expected term of
options granted is derived from the output of the option valuation model and represents, in a mathematical sense, the period of time that
options are expected to be outstanding. The risk-free rate for periods within the contractual life of the option is based on the U.S.
Constant Maturity Treasury yield curve in effect at the time of grant. There were no stock option awards granted in 2010.
For the year ended December 31,
2009 2008
Expected dividend yield 3.2% 2.9%
Expected annualized spot volatility 57.8% - 57.8% 37.0% - 32.2%
Weighted average annualized volatility 57.8% 33.3%
Risk-free spot rate 0.3% - 4.2% 2.0% - 5.0%
Expected term 7.3 years 8 years
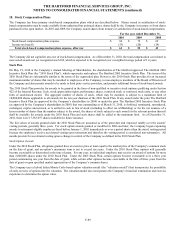
A summary of the status of non-qualified stock options included in the Company’ s Stock Plans as of December 31, 2010 and changes
during the year ended December 31, 2010 is presented below:
Number of Options
(in thousands)
Weighted
Average
Exercise Price
Weighted
Average
Remaining
Contractual
Term
Aggregate
Intrinsic Value
Outstanding at beginning of year 6,469 $ 49.76 3.8 $ —
Granted —
Exercised (36) 7.04
Forfeited (486) 39.57
Expired (668) 35.88
Outstanding at end of year 5,279 52.90 2.9 —
Exercisable at end of year 4,541 $ 58.01 2.2 —
The weighted average grant-date fair value of options granted during the years ended December 31, 2010, 2009 and 2008 was $0, $3.06
and $21.57, respectively. The total intrinsic value of options exercised during the years ended December 31, 2010, 2009 and 2008 was
$1, $0, and $4, respectively.
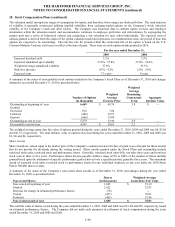
Share Awards
Share awards are valued equal to the market price of the Company’ s common stock on the date of grant, less a discount for those awards
that do not provide for dividends during the vesting period. Share awards granted under the Stock Plans and outstanding include
restricted stock units, restricted stock and performance shares. Generally, restricted stock units fully vest after three years and restricted
stock vests in three to five years. Performance shares become payable within a range of 0% to 200% of the number of shares initially
granted based upon the attainment of specific performance goals achieved over a specified period, generally three years. The maximum
award of restricted stock units, restricted stock or performance shares for any individual employee in any year under the 2010 Stock
Plan is 500,000 shares or units.
A summary of the status of the Company’ s non-vested share awards as of December 31, 2010, and changes during the year ended
December 31, 2010, is presented below:
Non-vested Shares
Shares
(in thousands)
Weighted-Average
Grant-Date Fair Value
Non-vested at beginning of year 1,845 $ 53.19
Granted 1,022 22.93
Decrease for change in estimated performance factors (78) —
Vested (437) 78.81
Forfeited (463) 27.46
Non-vested at end of year 1,889 $ 35.83
The total fair value of shares vested during the years ended December 31, 2010, 2009 and 2008 was $13, $8 and $35, respectively, based
on estimated performance factors. The Company did not make cash payments in settlement of stock compensation during the years
ended December 31, 2010 and 2009 and 2008.