The Hartford 2010 Annual Report Download - page 94
Download and view the complete annual report
Please find page 94 of the 2010 The Hartford annual report below. You can navigate through the pages in the report by either clicking on the pages listed below, or by using the keyword search tool below to find specific information within the annual report.-
 1
1 -
2
-
3
-
4
-
5
-
6
-
7
-
8
-
9
-
10
-
11
-
12
-
13
-
14
-
15
-
16
-
17
-
18
-
19
-
20
-
21
-
22
-
23
-
24
-
25
-
26
-
27
-
28
-
29
-
30
-
31
-
32
-
33
-
34
-
35
-
36
-
37
-
38
-
39
-
40
-
41
-
42
-
43
-
44
-
45
-
46
-
47
-
48
-
49
-
50
-
51
-
52
-
53
-
54
-
55
-
56
-
57
-
58
-
59
-
60
-
61
-
62
-
63
-
64
-
65
-
66
-
67
-
68
-
69
-
70
-
71
-
72
-
73
-
74
-
75
-
76
-
77
-
78
-
79
-
80
-
81
-
82
-
83
-
 84
84 -
 85
85 -
 86
86 -
 87
87 -
 88
88 -
 89
89 -
 90
90 -
 91
91 -
 92
92 -
 93
93 -
 94
94 -
 95
95 -
 96
96 -
 97
97 -
 98
98 -
 99
99 -
 100
100 -
 101
101 -
 102
102 -
 103
103 -
 104
104 -
105
-
106
-
107
-
108
-
109
-
110
-
111
-
112
-
113
-
114
-
115
-
116
-
117
-
118
-
119
-
120
-
121
-
122
-
123
-
124
-
125
-
126
-
127
-
128
-
129
-
130
-
131
-
132
-
133
-
134
-
135
-
136
-
137
-
138
-
139
-
140
-
141
-
142
-
143
-
144
-
145
-
146
-
147
-
148
-
149
-
150
-
151
-
152
-
153
-
154
-
155
-
156
-
157
-
158
-
159
-
160
-
161
-
162
-
163
-
164
-
165
-
166
-
167
-
168
-
169
-
170
-
171
-
172
-
173
-
174
-
175
-
176
-
177
-
178
-
179
-
180
-
181
-
182
-
183
-
184
-
185
-
186
-
187
-
188
-
189
-
190
-
191
-
192
-
193
-
194
-
195
-
196
-
197
-
198
-
199
-
200
-
201
-
202
-
203
-
204
-
205
-
206
-
207
-
208
-
209
-
210
-
211
-
212
-
213
-
214
-
215
-
216
-
217
-
218
-
219
-
220
-
221
-
222
-
223
-
224
-
225
-
226
-
227
-
228
-
229
-
230
-
231
-
232
-
233
-
234
-
235
-
236
-
237
-
238
-
239
-
240
-
241
-
242
-
243
-
244
-
245
-
246
-
247
-
248
 |
 |

94
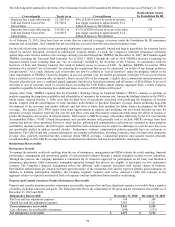
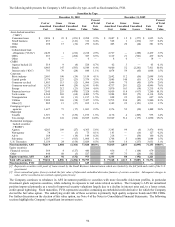
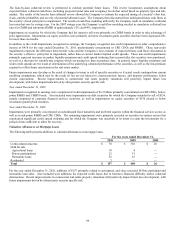
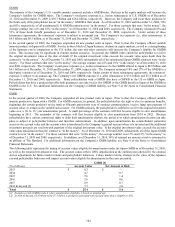
The following table presents the Company’ s AFS securities by type, as well as fixed maturities, FVO.
Securities by Type
December 31, 2010 December 31, 2009
Cost or
Amortized
Cost
Gross
Unrealized
Gains
Gross
Unrealized
Losses
Fair
Value
Percent
of Total
Fair
Value
Cost or
Amortized
Cost
Gross
Unrealized
Gains
Gross
Unrealized
Losses
Fair
Value
Percent
of Total
Fair
Value
Asset-backed securities
(“ABS”)
Consumer loans $ 2,496 $ 23 $ (221) $ 2,298 2.9% $ 2,087 $ 15 $ (277) $ 1,825 2.6%
Small business 453 — (141) 312 0.4% 548 1 (232) 317 0.4%
Other 298 15 (34) 279 0.4% 405 20 (44) 381 0.5%
CDOs
Collateralized loan
obligations (“CLOs”) 2,429 1 (212) 2,218 2.9% 2,727 — (288) 2,439 3.5%
CREs 653 — (266) 387 0.5% 1,319 21 (901) 439 0.6%
Other 6 — — 6 — 8 6 — 14 —
CMBS
Agency backed [1] 519 9 (4) 524 0.7% 62 3 — 65 0.1%
Bonds 6,985 147 (583) 6,549 8.4% 9,600 52 (2,241) 7,411 10.4%
Interest only (“IOs”) 793 79 (28) 844 1.1% 1,074 59 (65) 1,068 1.5%
Corporate
Basic industry 2,993 190 (24) 3,159 4.1% 2,642 112 (56) 2,698 3.8%
Capital goods 3,179 223 (23) 3,379 4.3% 3,085 140 (51) 3,174 4.5%
Consumer cyclical 1,883 115 (12) 1,986 2.6% 1,946 75 (45) 1,976 2.8%
Consumer non-cyclical 6,126 444 (29) 6,541 8.4% 4,737 281 (22) 4,996 7.0%
Energy 3,377 212 (23) 3,566 4.6% 3,070 163 (18) 3,215 4.5%
Financial services 7,545 253 (470) 7,328 9.4% 8,059 118 (917) 7,260 10.1%
Tech./comm. 4,268 269 (68) 4,469 5.7% 3,984 205 (75) 4,114 5.8%
Transportation 1,141 69 (13) 1,197 1.5% 698 22 (23) 697 1.0%
Utilities 7,099 386 (58) 7,427 9.5% 5,755 230 (85) 5,900 8.3%
Other [2] 885 13 (27) 832 1.1% 1,342 22 (151) 1,213 1.7%
Foreign govt./govt.
agencies 1,627 73 (17) 1,683 2.2% 1,376 52 (20) 1,408 2.0%
Municipal
Taxable 1,319 9 (129) 1,199 1.5% 1,176 4 (205) 975 1.4%
Tax-exempt 11,150 141 (366) 10,925 14.0% 10,949 314 (173) 11,090 15.6%
Residential mortgage-
backed securities
(“RMBS”)
Agency 4,283 109 (27) 4,365 5.6% 3,383 99 (6) 3,476 4.9%
Non-agency 78 — (3) 75 0.1% 143 — (16) 127 0.2%
Alt-A 168 — (19) 149 0.2% 218 — (58) 160 0.2%
Sub-prime 1,507 — (413) 1,094 1.4% 1,768 5 (689) 1,084 1.5%
U.S. Treasuries 5,159 24 (154) 5,029 6.5% 3,854 14 (237) 3,631 5.1%
Fixed maturities, AFS 78,419 2,804 (3,364) 77,820 100.0% 76,015 2,033 (6,895) 71,153 100.0%
Equity securities
Financial services 569 4 (127) 446 836 7 (164) 679
Other 444 88 (5) 527 497 73 (28) 542
Equity securities, AFS 1,013 92 (132) 973 1,333 80 (192) 1,221
Total AFS securities $ 79,432 $ 2,896 $ (3,496) $ 78,793 $ 77,348 $ 2,113 $ (7,087) $ 72,374
Fixed maturities, FVO $ 649 $ ––
[1] Represents securities with pools of loans issued by the Small Business Administration which are backed by the full faith and credit of the U.S.
government.
[2] Gross unrealized gains (losses) exclude the fair value of bifurcated embedded derivative features of certain securities. Subsequent changes in
value will be recorded in net realized capital gains (losses).
The Company continues to rebalance its AFS investment portfolio to securities with more favorable risk/return profiles, in particular
investment grade corporate securities, while reducing its exposure to real estate related securities. The Company’ s AFS net unrealized
position improved primarily as a result of improved security valuations largely due to a decline in interest rates and, to a lesser extent,
credit spread tightening. Fixed maturities, FVO, represents securities containing an embedded credit derivative for which the Company
elected the fair value option. The underlying credit risk of these securities is primarily high quality corporate bonds and CRE CDOs.
For further discussion on the election of fair value option, see Note 4 of the Notes to Consolidated Financial Statements. The following
sections highlight the Company’ s significant investment sectors.