The Hartford 2010 Annual Report Download - page 96
Download and view the complete annual report
Please find page 96 of the 2010 The Hartford annual report below. You can navigate through the pages in the report by either clicking on the pages listed below, or by using the keyword search tool below to find specific information within the annual report.-
 1
1 -
2
-
3
-
4
-
5
-
6
-
7
-
8
-
9
-
10
-
11
-
12
-
13
-
14
-
15
-
16
-
17
-
18
-
19
-
20
-
21
-
22
-
23
-
24
-
25
-
26
-
27
-
28
-
29
-
30
-
31
-
32
-
33
-
34
-
35
-
36
-
37
-
38
-
39
-
40
-
41
-
42
-
43
-
44
-
45
-
46
-
47
-
48
-
49
-
50
-
51
-
52
-
53
-
54
-
55
-
56
-
57
-
58
-
59
-
60
-
61
-
62
-
63
-
64
-
65
-
66
-
67
-
68
-
69
-
70
-
71
-
72
-
73
-
74
-
75
-
76
-
77
-
78
-
79
-
80
-
81
-
82
-
83
-
84
-
85
-
 86
86 -
 87
87 -
 88
88 -
 89
89 -
 90
90 -
 91
91 -
 92
92 -
 93
93 -
 94
94 -
 95
95 -
 96
96 -
 97
97 -
 98
98 -
 99
99 -
 100
100 -
 101
101 -
 102
102 -
 103
103 -
 104
104 -
 105
105 -
 106
106 -
107
-
108
-
109
-
110
-
111
-
112
-
113
-
114
-
115
-
116
-
117
-
118
-
119
-
120
-
121
-
122
-
123
-
124
-
125
-
126
-
127
-
128
-
129
-
130
-
131
-
132
-
133
-
134
-
135
-
136
-
137
-
138
-
139
-
140
-
141
-
142
-
143
-
144
-
145
-
146
-
147
-
148
-
149
-
150
-
151
-
152
-
153
-
154
-
155
-
156
-
157
-
158
-
159
-
160
-
161
-
162
-
163
-
164
-
165
-
166
-
167
-
168
-
169
-
170
-
171
-
172
-
173
-
174
-
175
-
176
-
177
-
178
-
179
-
180
-
181
-
182
-
183
-
184
-
185
-
186
-
187
-
188
-
189
-
190
-
191
-
192
-
193
-
194
-
195
-
196
-
197
-
198
-
199
-
200
-
201
-
202
-
203
-
204
-
205
-
206
-
207
-
208
-
209
-
210
-
211
-
212
-
213
-
214
-
215
-
216
-
217
-
218
-
219
-
220
-
221
-
222
-
223
-
224
-
225
-
226
-
227
-
228
-
229
-
230
-
231
-
232
-
233
-
234
-
235
-
236
-
237
-
238
-
239
-
240
-
241
-
242
-
243
-
244
-
245
-
246
-
247
-
248
 |
 |

96
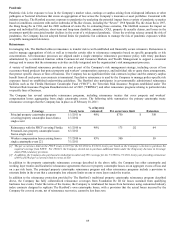
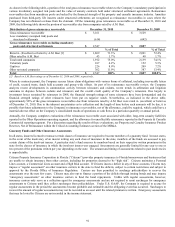
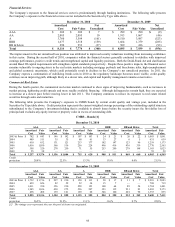
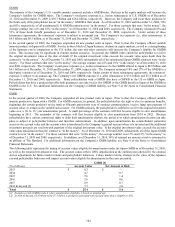
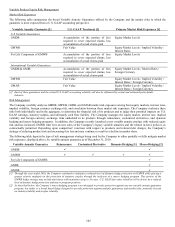
In addition to CMBS bonds, the Company has exposure to commercial mortgage loans as presented in the following table. These loans
are collateralized by a variety of commercial properties and are diversified both geographically throughout the United States and by
property type. These loans may be either in the form of a whole loan, where the Company is the sole lender, or a loan participation.
Loan participations are loans where the Company has purchased or retained a portion of an outstanding loan or package of loans and
participates on a pro-rata basis in collecting interest and principal pursuant to the terms of the participation agreement. In general, A-
Note participations have senior payment priority, followed by B-Note participations and then mezzanine loan participations. As of
December 31, 2010, loans within the Company’ s mortgage loan portfolio have had minimal extension or restructurings.
Commercial Mortgage Loans
December 31, 2010 December 31, 2009
Amortized
Cost [1]
Valuation
Allowance
Carrying
Value
Amortized
Cost [1]
Valuation
Allowance
Carrying
Value
Agricultural $ 339 $ (23) $ 316 $ 604 $ (8) $ 596
Whole loans 3,326 (23) 3,303 3,319 (40) 3,279
A-Note participations 319 — 319 391 — 391
B-Note participations 327 (70) 257 701 (176) 525
Mezzanine loans 181 (36) 145 1,081 (142) 939
Total [2] $ 4,492 $ (152) $ 4,340 $ 6,096 $ (366) $ 5,730
[1] Amortized cost represents carrying value prior to valuation allowances, if any.
[2] Excludes residential mortgage loans. For further information on the total mortgage loan portfolio, see Note 5 of the Notes to Consolidated
Financial Statements.
Since December 31, 2009, the Company significantly reduced its exposure to B-Note participations and mezzanine loans by $1.1 billion
primarily through sales. As of December 31, 2010, the Company had mortgage loans held-for-sale with a carrying value and valuation
allowance of $87 and $7, respectively.
During 2010, the Company funded $255 of commercial whole loans focusing on loans with strong loan-to-value (“LTV”) ratios and
high quality property collateral. At origination, these loans had a weighted average LTV of 60% and a weighted average yield of 5.0%.
For a discussion of outstanding mortgage loan commitments, see Off-Balance Sheet Arrangements and Aggregate Contractual
Obligations within the Capital Resources and Liquidity section of the MD&A and Note 12 of the Notes to Consolidated Financial
Statements.
Municipal Bonds
The Company holds investments in securities backed by states, municipalities and political subdivisions (“municipal”) with an
amortized cost and fair value of $12.5 billion and $12.1 billion, respectively, as of December 31, 2010 and $12.1 billion and $12.1
billion, respectively, as of December 31, 2009. The Company’ s municipal bond portfolio is well diversified and primarily consists of
essential service revenue and general obligation bonds.
During 2010, purchases in this sector were concentrated in essential service revenue bonds and general obligation bonds with an average
credit quality rating of AA. Sales during 2010 were concentrated in lower quality bonds or to reduce exposure in higher risk states such
as California, Illinois and Florida. As of December 31, 2010, the largest issuer concentrations were in California, Georgia and
Massachusetts, which each comprised less than 3% of the municipal bond portfolio and were primarily comprised of general obligation
securities. As of December 31, 2009, the largest issuer concentrations were in California, Georgia and Illinois, which each comprised
less than 3% of the municipal bond portfolio and were primarily comprised of general obligation securities.
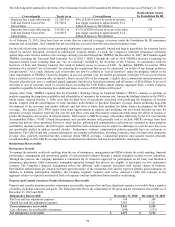
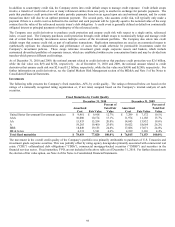
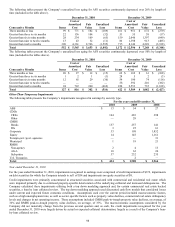
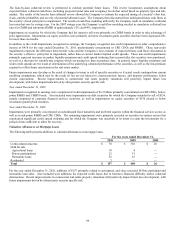
Limited Partnerships and Other Alternative Investments
The following table presents the Company’ s investments in limited partnerships and other alternative investments which include hedge
funds, mortgage and real estate funds, mezzanine debt funds, and private equity and other funds. Hedge funds include investments in
funds of funds and direct funds. Mortgage and real estate funds consist of investments in funds whose assets consist of mortgage loans,
mortgage loan participations, mezzanine loans or other notes which may be below investment grade, as well as equity real estate and
real estate joint ventures. Mezzanine debt funds include investments in funds whose assets consist of subordinated debt that often
incorporates equity-based options such as warrants and a limited amount of direct equity investments. Private equity and other funds
primarily consist of investments in funds whose assets typically consist of a diversified pool of investments in small non-public
businesses with high growth potential.
December 31, 2010 December 31, 2009
Amount Percent
Amount Percent
Hedge funds $ 439 22.8% $ 596 33.3%
Mortgage and real estate funds 406 21.2% 302 16.9%
Mezzanine debt funds 132 6.9% 133 7.4%
Private equity and other funds 941 49.1% 759 42.4%
Total $ 1,918 100.0% $ 1,790 100.0%