The Hartford 2010 Annual Report Download - page 71
Download and view the complete annual report
Please find page 71 of the 2010 The Hartford annual report below. You can navigate through the pages in the report by either clicking on the pages listed below, or by using the keyword search tool below to find specific information within the annual report.-
 1
1 -
2
-
3
-
4
-
5
-
6
-
7
-
8
-
9
-
10
-
11
-
12
-
13
-
14
-
15
-
16
-
17
-
18
-
19
-
20
-
21
-
22
-
23
-
24
-
25
-
26
-
27
-
28
-
29
-
30
-
31
-
32
-
33
-
34
-
35
-
36
-
37
-
38
-
39
-
40
-
41
-
42
-
43
-
44
-
45
-
46
-
47
-
48
-
49
-
50
-
51
-
52
-
53
-
54
-
55
-
56
-
57
-
58
-
59
-
60
-
 61
61 -
 62
62 -
 63
63 -
 64
64 -
 65
65 -
 66
66 -
 67
67 -
 68
68 -
 69
69 -
 70
70 -
 71
71 -
 72
72 -
 73
73 -
 74
74 -
 75
75 -
 76
76 -
 77
77 -
 78
78 -
 79
79 -
 80
80 -
 81
81 -
82
-
83
-
84
-
85
-
86
-
87
-
88
-
89
-
90
-
91
-
92
-
93
-
94
-
95
-
96
-
97
-
98
-
99
-
100
-
101
-
102
-
103
-
104
-
105
-
106
-
107
-
108
-
109
-
110
-
111
-
112
-
113
-
114
-
115
-
116
-
117
-
118
-
119
-
120
-
121
-
122
-
123
-
124
-
125
-
126
-
127
-
128
-
129
-
130
-
131
-
132
-
133
-
134
-
135
-
136
-
137
-
138
-
139
-
140
-
141
-
142
-
143
-
144
-
145
-
146
-
147
-
148
-
149
-
150
-
151
-
152
-
153
-
154
-
155
-
156
-
157
-
158
-
159
-
160
-
161
-
162
-
163
-
164
-
165
-
166
-
167
-
168
-
169
-
170
-
171
-
172
-
173
-
174
-
175
-
176
-
177
-
178
-
179
-
180
-
181
-
182
-
183
-
184
-
185
-
186
-
187
-
188
-
189
-
190
-
191
-
192
-
193
-
194
-
195
-
196
-
197
-
198
-
199
-
200
-
201
-
202
-
203
-
204
-
205
-
206
-
207
-
208
-
209
-
210
-
211
-
212
-
213
-
214
-
215
-
216
-
217
-
218
-
219
-
220
-
221
-
222
-
223
-
224
-
225
-
226
-
227
-
228
-
229
-
230
-
231
-
232
-
233
-
234
-
235
-
236
-
237
-
238
-
239
-
240
-
241
-
242
-
243
-
244
-
245
-
246
-
247
-
248
 |
 |

71
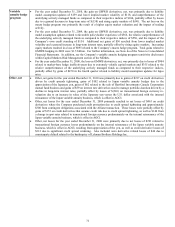
Variable
annuity hedge
program
• For the year ended December 31, 2010, the gain on GMWB derivatives, net, was primarily due to liability
model assumption updates of $159 and lower implied market volatility of $118, and outperformance of the
underlying actively managed funds as compared to their respective indices of $104, partially offset by losses
due to a general decrease in long-term rates of $(158) and rising equity markets of $(90). The net loss on the
macro hedge program was primarily the result of a higher equity market valuation and the impact of trading
activity.
• For the year ended December 31, 2009, the gain on GMWB derivatives, net, was primarily due to liability
model assumption updates related to favorable policyholder experience of $566, the relative outperformance of
the underlying actively managed funds as compared to their respective indices of $550, and the impact of the
Company’ s own credit standing of $154. Additional net gains of $56 resulted from lower implied market
volatility and a general increase in long-term interest rates, partially offset by rising equity markets. Increasing
equity markets resulted in a loss of $895 related to the Company’ s macro hedge program. Total gains related to
GMWB hedging in 2009 were $1.5 billion. For further information, see Note 4a of the Notes to Consolidated
Financial Statements. In addition, see the Company’ s variable annuity hedging program sensitivity disclosures
within Capital Markets Risk Management section of the MD&A.
• For the year ended December 31, 2008, the loss on GMWB derivatives, net, was primarily due to losses of $904
related to market-base hedge ineffectiveness due to extremely volatile capital markets and $355 related to the
relative outperformance of the underlying actively managed funds as compared to their respective indices,
partially offset by gains of $470 in the fourth quarter related to liability model assumption updates for lapse
rates.
Other, net • Other, net gains for the year ended December 31, 2010 was primarily due to gains of $217 on credit derivatives
driven by credit spreads tightening, gains of $102 related to Japan variable annuity hedges due to the
appreciation of the Japanese yen, gains of $62 related to the sale of Hartford Investments Canada Corporation
mutual fund business and gains of $59 on interest rate derivatives used to manage portfolio duration driven by a
decline in long-term interest rates, partially offset by losses of $(326) on transactional foreign currency re-
valuation due to an increase in value of the Japanese yen versus the U.S. dollar associated with the internal
reinsurance of the Japan variable annuity business, which is offset in AOCI.
• Other, net losses for the year ended December 31, 2009 primarily resulted in net losses of $463 on credit
derivatives where the Company purchased credit protection due to credit spread tightening and approximately
$300 from contingent obligations associated with the Allianz transaction. These losses were partially offset by
gains of $155 on credit derivatives that assume credit risk due to credit spread tightening, as well as $140 from
a change in spot rates related to transactional foreign currency predominately on the internal reinsurance of the
Japan variable annuity business, which is offset in AOCI.
• Other, net losses for the year ended December 31, 2008 were primarily due to net losses of $291 related to
transactional foreign currency losses predominately on the internal reinsurance of the Japan variable annuity
business, which is offset in AOCI, resulting from appreciation of the yen, as well as credit derivative losses of
$312 due to significant credit spread widening. Also included were derivative related losses of $46 due to
counterparty default related to the bankruptcy of Lehman Brothers Holdings Inc.