The Hartford 2010 Annual Report Download - page 91
Download and view the complete annual report
Please find page 91 of the 2010 The Hartford annual report below. You can navigate through the pages in the report by either clicking on the pages listed below, or by using the keyword search tool below to find specific information within the annual report.-
 1
1 -
2
-
3
-
4
-
5
-
6
-
7
-
8
-
9
-
10
-
11
-
12
-
13
-
14
-
15
-
16
-
17
-
18
-
19
-
20
-
21
-
22
-
23
-
24
-
25
-
26
-
27
-
28
-
29
-
30
-
31
-
32
-
33
-
34
-
35
-
36
-
37
-
38
-
39
-
40
-
41
-
42
-
43
-
44
-
45
-
46
-
47
-
48
-
49
-
50
-
51
-
52
-
53
-
54
-
55
-
56
-
57
-
58
-
59
-
60
-
61
-
62
-
63
-
64
-
65
-
66
-
67
-
68
-
69
-
70
-
71
-
72
-
73
-
74
-
75
-
76
-
77
-
78
-
79
-
80
-
 81
81 -
 82
82 -
 83
83 -
 84
84 -
 85
85 -
 86
86 -
 87
87 -
 88
88 -
 89
89 -
 90
90 -
 91
91 -
 92
92 -
 93
93 -
 94
94 -
 95
95 -
 96
96 -
 97
97 -
 98
98 -
 99
99 -
 100
100 -
 101
101 -
102
-
103
-
104
-
105
-
106
-
107
-
108
-
109
-
110
-
111
-
112
-
113
-
114
-
115
-
116
-
117
-
118
-
119
-
120
-
121
-
122
-
123
-
124
-
125
-
126
-
127
-
128
-
129
-
130
-
131
-
132
-
133
-
134
-
135
-
136
-
137
-
138
-
139
-
140
-
141
-
142
-
143
-
144
-
145
-
146
-
147
-
148
-
149
-
150
-
151
-
152
-
153
-
154
-
155
-
156
-
157
-
158
-
159
-
160
-
161
-
162
-
163
-
164
-
165
-
166
-
167
-
168
-
169
-
170
-
171
-
172
-
173
-
174
-
175
-
176
-
177
-
178
-
179
-
180
-
181
-
182
-
183
-
184
-
185
-
186
-
187
-
188
-
189
-
190
-
191
-
192
-
193
-
194
-
195
-
196
-
197
-
198
-
199
-
200
-
201
-
202
-
203
-
204
-
205
-
206
-
207
-
208
-
209
-
210
-
211
-
212
-
213
-
214
-
215
-
216
-
217
-
218
-
219
-
220
-
221
-
222
-
223
-
224
-
225
-
226
-
227
-
228
-
229
-
230
-
231
-
232
-
233
-
234
-
235
-
236
-
237
-
238
-
239
-
240
-
241
-
242
-
243
-
244
-
245
-
246
-
247
-
248
 |
 |

91
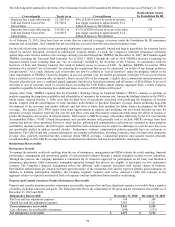
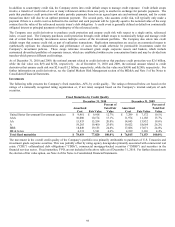
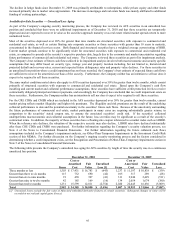
As shown in the following table, a portion of the total gross reinsurance recoverable relates to the Company’ s mandatory participation in
various involuntary assigned risk pools and the value of annuity contracts held under structured settlement agreements. Reinsurance
recoverables due from mandatory pools are backed by the financial strength of the property and casualty insurance industry. Annuities
purchased from third-party life insurers under structured settlements are recognized as reinsurance recoverables in cases where the
Company has not obtained a release from the claimant. Of the remaining gross reinsurance recoverable as of December 31, 2010 and
2009, the following table shows the portion of recoverables due from companies rated by A.M. Best.
Distribution of gross reinsurance recoverable December 31, 2010 December 31, 2009
Gross reinsurance recoverable $ 3,161 $ 3,529
Less: mandatory (assigned risk) pools and
structured settlements (614) (642)
Gross reinsurance recoverable excluding mandatory
pools and structured settlements $ 2,547
$2,887
% of Total
% of Total
Rated A- (Excellent) or better by A.M. Best [1] $ 1,869 73.3% $ 2,091 72.4%
Other rated by A.M. Best 43 1.7% 48 1.7%
Total rated companies 1,912 75.0% 2,139 74.1%
Voluntary pools 107 4.2% 152 5.3%
Captives 226 8.9% 209 7.2%
Other not rated companies 302 11.9% 387 13.4%
Total $ 2,547 100% $ 2,887 100.0%
[1] Based on A.M. Best ratings as of December 31, 2010 and 2009, respectively.
Where its contracts permit, the Company secures future claim obligations with various forms of collateral, including irrevocable letters
of credit, secured trusts, funds held accounts and group wide offsets. As part of its reinsurance recoverable review, the Company
analyzes recent developments in commutation activity between reinsurers and cedants, recent trends in arbitration and litigation
outcomes in disputes between cedants and reinsurers and the overall credit quality of the Company’ s reinsurers. Due largely to
investment losses sustained by reinsurers in 2008, the financial strength ratings of some reinsurers have been downgraded and the
financial strength ratings of other reinsurers have been put on negative watch. Nevertheless, as indicated in the above table,
approximately 98% of the gross reinsurance recoverables due from reinsurers rated by A.M. Best were rated A- (excellent) or better as
of December 31, 2010. Due to the inherent uncertainties as to collection and the length of time before such amounts will be due, it is
possible that future adjustments to the Company’ s reinsurance recoverables, net of the allowance, could be required, which could have a
material adverse effect on the Company’ s consolidated results of operations or cash flows in a particular quarterly or annual period.
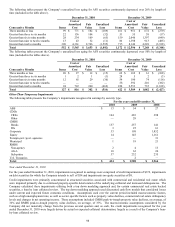
Annually, the Company completes evaluations of the reinsurance recoverable asset associated with older, long-term casualty liabilities
reported in the Other Operations operating segment, and the allowance for uncollectible reinsurance reported in the Property & Casualty
Commercial reporting segment. For a discussion regarding the results of these evaluations, see Property and Casualty Insurance Product
Reserves, Net of Reinsurance within the Critical Accounting Estimates section of the MD&A.
Guaranty Funds and Other Insurance Assessments
In all states, insurers licensed to transact certain classes of insurance are required to become members of a guaranty fund. In most states,
in the event of the insolvency of an insurer writing any such class of insurance in the state, members of the funds are assessed to pay
certain claims of the insolvent insurer. A particular state’ s fund assesses its members based on their respective written premiums in the
state for the classes of insurance in which the insolvent insurer was engaged. Assessments are generally limited for any year to one or
two percent of the premiums written per year depending on the state. The amount and timing of assessments related to past insolvencies
is unpredictable.
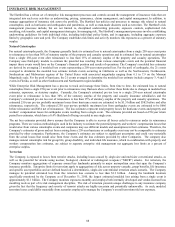
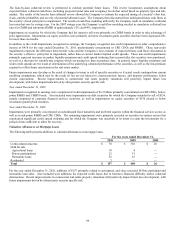
Citizens Property Insurance Corporation in Florida (“Citizens”) provides property insurance to Florida homeowners and businesses that
are unable to obtain insurance from other carriers, including for properties deemed to be “high risk”. Citizens maintains a Personal
Lines account, a Commercial Lines account and a High Risk account. If Citizens incurs a deficit in any of these accounts, Citizens may
impose a “regular assessment” on other insurance carriers in the state to fund the deficits, subject to certain restrictions and subject to
approval by the Florida Office of Insurance Regulation. Carriers are then permitted to surcharge policyholders to recover the
assessments over the next few years. Citizens may also opt to finance a portion of the deficits through issuing bonds and may impose
“emergency assessments” on other insurance carriers to fund the bond repayments. Unlike with regular assessments, however,
insurance carriers only serve as a collection agent for emergency assessments and are not required to remit surcharges for emergency
assessments to Citizens until they collect surcharges from policyholders. Under U.S. GAAP, the Company is required to accrue for
regular assessments in the period the assessments become probable and estimable and the obligating event has occurred. Surcharges to
recover the amount of regular assessments may not be recorded as an asset until the related premium is written. Emergency assessments
that may be levied by Citizens are not recorded in the income statement.