The Hartford 2010 Annual Report Download - page 118
Download and view the complete annual report
Please find page 118 of the 2010 The Hartford annual report below. You can navigate through the pages in the report by either clicking on the pages listed below, or by using the keyword search tool below to find specific information within the annual report.-
 1
1 -
2
-
3
-
4
-
5
-
6
-
7
-
8
-
9
-
10
-
11
-
12
-
13
-
14
-
15
-
16
-
17
-
18
-
19
-
20
-
21
-
22
-
23
-
24
-
25
-
26
-
27
-
28
-
29
-
30
-
31
-
32
-
33
-
34
-
35
-
36
-
37
-
38
-
39
-
40
-
41
-
42
-
43
-
44
-
45
-
46
-
47
-
48
-
49
-
50
-
51
-
52
-
53
-
54
-
55
-
56
-
57
-
58
-
59
-
60
-
61
-
62
-
63
-
64
-
65
-
66
-
67
-
68
-
69
-
70
-
71
-
72
-
73
-
74
-
75
-
76
-
77
-
78
-
79
-
80
-
81
-
82
-
83
-
84
-
85
-
86
-
87
-
88
-
89
-
90
-
91
-
92
-
93
-
94
-
95
-
96
-
97
-
98
-
99
-
100
-
101
-
102
-
103
-
104
-
105
-
106
-
107
-
 108
108 -
 109
109 -
 110
110 -
 111
111 -
 112
112 -
 113
113 -
 114
114 -
 115
115 -
 116
116 -
 117
117 -
 118
118 -
 119
119 -
 120
120 -
 121
121 -
 122
122 -
 123
123 -
 124
124 -
 125
125 -
 126
126 -
 127
127 -
 128
128 -
129
-
130
-
131
-
132
-
133
-
134
-
135
-
136
-
137
-
138
-
139
-
140
-
141
-
142
-
143
-
144
-
145
-
146
-
147
-
148
-
149
-
150
-
151
-
152
-
153
-
154
-
155
-
156
-
157
-
158
-
159
-
160
-
161
-
162
-
163
-
164
-
165
-
166
-
167
-
168
-
169
-
170
-
171
-
172
-
173
-
174
-
175
-
176
-
177
-
178
-
179
-
180
-
181
-
182
-
183
-
184
-
185
-
186
-
187
-
188
-
189
-
190
-
191
-
192
-
193
-
194
-
195
-
196
-
197
-
198
-
199
-
200
-
201
-
202
-
203
-
204
-
205
-
206
-
207
-
208
-
209
-
210
-
211
-
212
-
213
-
214
-
215
-
216
-
217
-
218
-
219
-
220
-
221
-
222
-
223
-
224
-
225
-
226
-
227
-
228
-
229
-
230
-
231
-
232
-
233
-
234
-
235
-
236
-
237
-
238
-
239
-
240
-
241
-
242
-
243
-
244
-
245
-
246
-
247
-
248
 |
 |

118
Equity Markets
For a discussion of the potential impact of the equity markets on capital and liquidity, see the Capital Markets Risk Management section
under “Market Risk”.
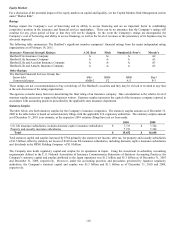
Ratings
Ratings impact the Company’ s cost of borrowing and its ability to access financing and are an important factor in establishing
competitive position in the insurance and financial services marketplace. There can be no assurance that the Company’ s ratings will
continue for any given period of time or that they will not be changed. In the event the Company's ratings are downgraded, the
Company’ s cost of borrowing and ability to access financing, as well as the level of revenues or the persistency of its business may be
adversely impacted.
The following table summarizes The Hartford’ s significant member companies’ financial ratings from the major independent rating
organizations as of February 18, 2011.
Insurance Financial Strength Ratings: A.M. Best Fitch Standard & Poor’s Moody’s
Hartford Fire Insurance Company A A+ A A2
Hartford Life Insurance Company A A- A A3
Hartford Life and Accident Insurance Company A A- A A3
Hartford Life and Annuity Insurance Company A A- A A3
Other Ratings:
The Hartford Financial Services Group, Inc.:
Senior debt
Commercial paper
bbb+
AMB-2
BBB-
F2
BBB
A-2
Baa3
P-3
These ratings are not a recommendation to buy or hold any of The Hartford’ s securities and they may be revised or revoked at any time
at the sole discretion of the rating organization.
The agencies consider many factors in determining the final rating of an insurance company. One consideration is the relative level of
statutory surplus necessary to support the business written. Statutory surplus represents the capital of the insurance company reported in
accordance with accounting practices prescribed by the applicable state insurance department.
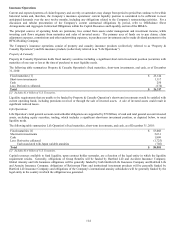
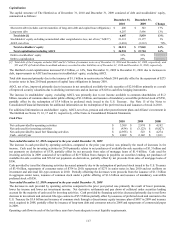
Statutory Surplus
The table below sets forth statutory surplus for the Company’ s insurance companies. The statutory surplus amount as of December 31,
2009 in the table below is based on actual statutory filings with the applicable U.S. regulatory authorities. The statutory surplus amount
as of December 31, 2010 is an estimate, as the respective 2010 statutory filings have not yet been made.
2010 2009
U.S. life insurance subsidiaries, includes domestic captive insurance subsidiaries $ 7,731 $7,324
Property and casualty insurance subsidiaries 7,721 7,364
Total $ 15,452 $14,688
Total statutory capital and surplus increased by $764 primarily due statutory net income, after tax, for property and casualty subsidiaries
of $1.5 billion, offset by statutory net losses of $140 in our life insurance subsidiaries, including domestic captive insurance subsidiaries
and dividends to the HFSG Holding Company of $1.0 billion.
The Company also holds regulatory capital and surplus for its operations in Japan. Using the investment in subsidiary accounting
requirements defined in the U.S. National Association of Insurance Commissioners Statements of Statutory Accounting Practices, the
Company’ s statutory capital and surplus attributed to the Japan operations was $1.2 billion and $1.3 billion as of December 31, 2010
and December 31, 2009, respectively. However, under the accounting practices and procedures governed by Japanese regulatory
authorities, the Company’ s statutory capital and surplus was $1.3 billion and $1.1 billion as of December 31, 2010 and 2009,
respectively.