The Hartford 2010 Annual Report Download - page 43
Download and view the complete annual report
Please find page 43 of the 2010 The Hartford annual report below. You can navigate through the pages in the report by either clicking on the pages listed below, or by using the keyword search tool below to find specific information within the annual report.-
 1
1 -
2
-
3
-
4
-
5
-
6
-
7
-
8
-
9
-
10
-
11
-
12
-
13
-
14
-
15
-
16
-
17
-
18
-
19
-
20
-
21
-
22
-
23
-
24
-
25
-
26
-
27
-
28
-
29
-
30
-
31
-
32
-
 33
33 -
 34
34 -
 35
35 -
 36
36 -
 37
37 -
 38
38 -
 39
39 -
 40
40 -
 41
41 -
 42
42 -
 43
43 -
 44
44 -
 45
45 -
 46
46 -
 47
47 -
 48
48 -
 49
49 -
 50
50 -
 51
51 -
 52
52 -
 53
53 -
54
-
55
-
56
-
57
-
58
-
59
-
60
-
61
-
62
-
63
-
64
-
65
-
66
-
67
-
68
-
69
-
70
-
71
-
72
-
73
-
74
-
75
-
76
-
77
-
78
-
79
-
80
-
81
-
82
-
83
-
84
-
85
-
86
-
87
-
88
-
89
-
90
-
91
-
92
-
93
-
94
-
95
-
96
-
97
-
98
-
99
-
100
-
101
-
102
-
103
-
104
-
105
-
106
-
107
-
108
-
109
-
110
-
111
-
112
-
113
-
114
-
115
-
116
-
117
-
118
-
119
-
120
-
121
-
122
-
123
-
124
-
125
-
126
-
127
-
128
-
129
-
130
-
131
-
132
-
133
-
134
-
135
-
136
-
137
-
138
-
139
-
140
-
141
-
142
-
143
-
144
-
145
-
146
-
147
-
148
-
149
-
150
-
151
-
152
-
153
-
154
-
155
-
156
-
157
-
158
-
159
-
160
-
161
-
162
-
163
-
164
-
165
-
166
-
167
-
168
-
169
-
170
-
171
-
172
-
173
-
174
-
175
-
176
-
177
-
178
-
179
-
180
-
181
-
182
-
183
-
184
-
185
-
186
-
187
-
188
-
189
-
190
-
191
-
192
-
193
-
194
-
195
-
196
-
197
-
198
-
199
-
200
-
201
-
202
-
203
-
204
-
205
-
206
-
207
-
208
-
209
-
210
-
211
-
212
-
213
-
214
-
215
-
216
-
217
-
218
-
219
-
220
-
221
-
222
-
223
-
224
-
225
-
226
-
227
-
228
-
229
-
230
-
231
-
232
-
233
-
234
-
235
-
236
-
237
-
238
-
239
-
240
-
241
-
242
-
243
-
244
-
245
-
246
-
247
-
248
 |
 |

43
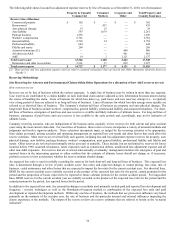
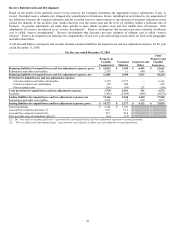
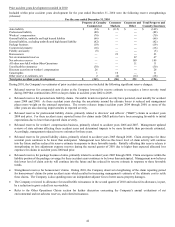
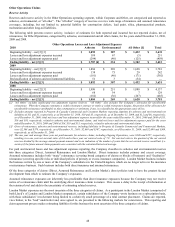
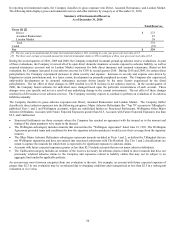
A roll-forward follows of property and casualty insurance product liabilities for unpaid losses and loss adjustment expenses for the year
ended December 31, 2009:
For the year ended December 31, 2009
Property &
Casualty
Commercial
Consumer
Markets
Corporate and
Other
Total
Property and
Casualty
Insurance
Beginning liabilities for unpaid losses and loss adjustment expenses, gross $15,273 $2,083 $ 4,577 $ 21,933
Reinsurance and other recoverables 2,742 46 798 3,586
Beginning liabilities for unpaid losses and loss adjustment expenses, net 12,531 2,037 3,779 18,347
Provision for unpaid losses and loss adjustment expenses
Current accident year before catastrophes 3,582 2,707 1 6,290
Current accident year catastrophes 78 228 — 306
Prior accident years (394) (33) 241 (186)
Total provision for unpaid losses and loss adjustment expenses 3,266 2,902 242 6,410
Payments (3,316) (2,841) (390) (6,547)
Ending liabilities for unpaid losses and loss adjustment expenses, net 12,481 2,098 3,631 18,210
Reinsurance and other recoverables 2,570 11 860 3,441
Ending liabilities for unpaid losses and loss adjustment expenses, gross $15,051 $2,109 $ 4,491 $ 21,651
Earned premiums $5,903 $3,959
Loss and loss expense paid ratio [1] 56.2 71.8
Loss and loss expense incurred ratio 55.3 73.3
Prior accident years development (pts) [2] (6.7) (0.8)
[1] The “loss and loss expense paid ratio” represents the ratio of paid losses and loss adjustment expenses to earned premiums.
[2] “Prior accident years development (pts)” represents the ratio of prior accident years development to earned premiums.
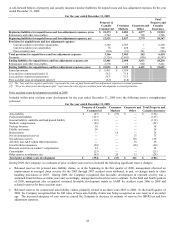
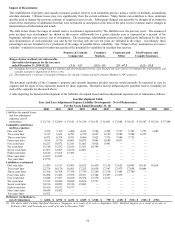
Prior accident years development recorded in 2009
Included within prior accident years development for the year ended December 31, 2009 were the following reserve strengthenings
(releases):
For the year ended December 31, 2009
Propert
y
& Casualt
y
Commercial
Consumer
Markets
Corporate and
Other
Total Property and
Casualty Insurance
Auto liability $(47) $(77) $ — $ (124)
Professional liability (127) — — (127)
General liability, umbrella and high hazard liability (112) — — (112)
Workers’ compensation (92) — — (92)
Package business 38 — — 38
Fidelity and surety 28 — — 28
Homeowners — 18 — 18
Net environmental reserves — — 75 75
Net asbestos reserves — — 138 138
All other non-A&E within Other Operations — — 35 35
Uncollectible reinsurance (20) — (20) (40)
Discount accretion on workers' compensation 24 — — 24
Catastrophes (23) — — (23)
Other reserve re-estimates, net (63) 26 13 (24)
Total prior accident years development $ (394) $ (33) $ 241 $ (186)
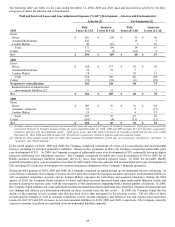
During 2009, the Company’ s re-estimates of prior accident years reserves included the following significant reserve changes:
• Released reserves for personal auto liability claims, as in the beginning in the first quarter of 2008, management observed an
improvement in emerged claim severity for the 2005 through 2007 accident years attributed, in part, to changes made in claim
handling procedures in 2007. During 2009, the Company recognized that favorable development in reported severity was a
sustained trend for those accident years and, accordingly, management reduced its reserve estimate. In the third and fourth quarters
of 2009, management also recognized sustained favorable development trends in AARP for accident years 2006 to 2008 and
released reserves for those accident years.
• Released reserves for commercial auto liability claims, primarily related to accident years 2003 to 2008. In the fourth quarter of
2009, the Company recognized that the full value of large auto liability claims was being recognized as case reserves at an earlier
age. The increased adequacy of case reserves caused the Company to decrease its estimate of reserves for IBNR loss and loss
adjustment expenses.