The Hartford 2010 Annual Report Download - page 106
Download and view the complete annual report
Please find page 106 of the 2010 The Hartford annual report below. You can navigate through the pages in the report by either clicking on the pages listed below, or by using the keyword search tool below to find specific information within the annual report.-
 1
1 -
2
-
3
-
4
-
5
-
6
-
7
-
8
-
9
-
10
-
11
-
12
-
13
-
14
-
15
-
16
-
17
-
18
-
19
-
20
-
21
-
22
-
23
-
24
-
25
-
26
-
27
-
28
-
29
-
30
-
31
-
32
-
33
-
34
-
35
-
36
-
37
-
38
-
39
-
40
-
41
-
42
-
43
-
44
-
45
-
46
-
47
-
48
-
49
-
50
-
51
-
52
-
53
-
54
-
55
-
56
-
57
-
58
-
59
-
60
-
61
-
62
-
63
-
64
-
65
-
66
-
67
-
68
-
69
-
70
-
71
-
72
-
73
-
74
-
75
-
76
-
77
-
78
-
79
-
80
-
81
-
82
-
83
-
84
-
85
-
86
-
87
-
88
-
89
-
90
-
91
-
92
-
93
-
94
-
95
-
 96
96 -
 97
97 -
 98
98 -
 99
99 -
 100
100 -
 101
101 -
 102
102 -
 103
103 -
 104
104 -
 105
105 -
 106
106 -
 107
107 -
 108
108 -
 109
109 -
 110
110 -
 111
111 -
 112
112 -
 113
113 -
 114
114 -
 115
115 -
 116
116 -
117
-
118
-
119
-
120
-
121
-
122
-
123
-
124
-
125
-
126
-
127
-
128
-
129
-
130
-
131
-
132
-
133
-
134
-
135
-
136
-
137
-
138
-
139
-
140
-
141
-
142
-
143
-
144
-
145
-
146
-
147
-
148
-
149
-
150
-
151
-
152
-
153
-
154
-
155
-
156
-
157
-
158
-
159
-
160
-
161
-
162
-
163
-
164
-
165
-
166
-
167
-
168
-
169
-
170
-
171
-
172
-
173
-
174
-
175
-
176
-
177
-
178
-
179
-
180
-
181
-
182
-
183
-
184
-
185
-
186
-
187
-
188
-
189
-
190
-
191
-
192
-
193
-
194
-
195
-
196
-
197
-
198
-
199
-
200
-
201
-
202
-
203
-
204
-
205
-
206
-
207
-
208
-
209
-
210
-
211
-
212
-
213
-
214
-
215
-
216
-
217
-
218
-
219
-
220
-
221
-
222
-
223
-
224
-
225
-
226
-
227
-
228
-
229
-
230
-
231
-
232
-
233
-
234
-
235
-
236
-
237
-
238
-
239
-
240
-
241
-
242
-
243
-
244
-
245
-
246
-
247
-
248
 |
 |

106
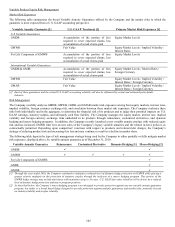
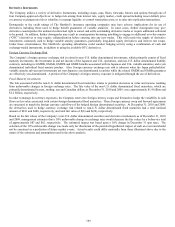
Reinsurance
The Company uses reinsurance for a portion of contracts with GMWB riders issued prior to the third quarter of 2003 and GMWB risks
associated with a block of business sold between the third quarter of 2003 and the second quarter of 2006. The Company also uses
reinsurance for a majority of the GMDB issued in the U.S. and a portion of the GMDB issued in Japan.
Derivative Hedging Strategies
The Company maintains derivative hedging strategies for its product guarantee risk to meet multiple, and in some cases, competing risk
management objectives, including providing protection against tail scenario market events, providing resources to pay product guarantee
claims, and minimizing U.S. GAAP earnings volatility, statutory surplus volatility and other economic metrics.
Customized Derivatives
The Company holds customized derivative contracts to provide protection from certain capital market risks for the remaining term of
specified blocks of non-reinsured GMWB riders. These customized derivative contracts are based on policyholder behavior assumptions
specified at the inception of the derivative contracts. The Company retains the risk for differences between assumed and actual
policyholder behavior and between the performance of the actively managed funds underlying the separate accounts and their respective
indices.
Dynamic Hedging
The Company’ s dynamic hedging program uses derivative instruments to provide protection against the risks associated with the
GMWB variable annuity product guarantees including equity market declines, equity implied volatility, and declines in interest rates
(See Market Risk on Statutory Capital below). The Company uses hedging instruments including: interest rate futures and swaps,
variance swaps, S&P 500, NASDAQ and EAFE index put options and futures contracts. During the year, the Company added additional
volatility protection. While the Company actively manages this dynamic hedging program, increased U.S. GAAP earnings volatility
may result from factors including, but not limited to: policyholder behavior, capital markets, divergence between the performance of the
underlying funds and the hedging indices, changes in hedging positions and the relative emphasis placed on various risk management
objectives.