The Hartford 2010 Annual Report Download - page 103
Download and view the complete annual report
Please find page 103 of the 2010 The Hartford annual report below. You can navigate through the pages in the report by either clicking on the pages listed below, or by using the keyword search tool below to find specific information within the annual report.-
 1
1 -
2
-
3
-
4
-
5
-
6
-
7
-
8
-
9
-
10
-
11
-
12
-
13
-
14
-
15
-
16
-
17
-
18
-
19
-
20
-
21
-
22
-
23
-
24
-
25
-
26
-
27
-
28
-
29
-
30
-
31
-
32
-
33
-
34
-
35
-
36
-
37
-
38
-
39
-
40
-
41
-
42
-
43
-
44
-
45
-
46
-
47
-
48
-
49
-
50
-
51
-
52
-
53
-
54
-
55
-
56
-
57
-
58
-
59
-
60
-
61
-
62
-
63
-
64
-
65
-
66
-
67
-
68
-
69
-
70
-
71
-
72
-
73
-
74
-
75
-
76
-
77
-
78
-
79
-
80
-
81
-
82
-
83
-
84
-
85
-
86
-
87
-
88
-
89
-
90
-
91
-
92
-
 93
93 -
 94
94 -
 95
95 -
 96
96 -
 97
97 -
 98
98 -
 99
99 -
 100
100 -
 101
101 -
 102
102 -
 103
103 -
 104
104 -
 105
105 -
 106
106 -
 107
107 -
 108
108 -
 109
109 -
 110
110 -
 111
111 -
 112
112 -
 113
113 -
114
-
115
-
116
-
117
-
118
-
119
-
120
-
121
-
122
-
123
-
124
-
125
-
126
-
127
-
128
-
129
-
130
-
131
-
132
-
133
-
134
-
135
-
136
-
137
-
138
-
139
-
140
-
141
-
142
-
143
-
144
-
145
-
146
-
147
-
148
-
149
-
150
-
151
-
152
-
153
-
154
-
155
-
156
-
157
-
158
-
159
-
160
-
161
-
162
-
163
-
164
-
165
-
166
-
167
-
168
-
169
-
170
-
171
-
172
-
173
-
174
-
175
-
176
-
177
-
178
-
179
-
180
-
181
-
182
-
183
-
184
-
185
-
186
-
187
-
188
-
189
-
190
-
191
-
192
-
193
-
194
-
195
-
196
-
197
-
198
-
199
-
200
-
201
-
202
-
203
-
204
-
205
-
206
-
207
-
208
-
209
-
210
-
211
-
212
-
213
-
214
-
215
-
216
-
217
-
218
-
219
-
220
-
221
-
222
-
223
-
224
-
225
-
226
-
227
-
228
-
229
-
230
-
231
-
232
-
233
-
234
-
235
-
236
-
237
-
238
-
239
-
240
-
241
-
242
-
243
-
244
-
245
-
246
-
247
-
248
 |
 |

103
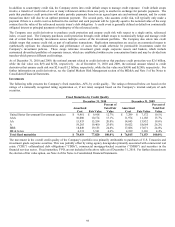
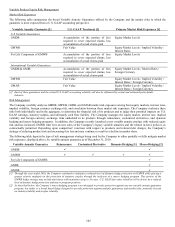
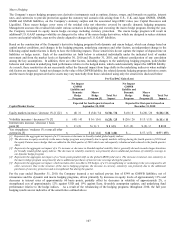
Equity Risk
The Company’ s primary exposure to equity risk relates to the potential for lower earnings associated with certain of the Wealth
Management’ s businesses such as variable annuities where fee income is earned based upon the fair value of the assets under
management. For further discussion of equity risk, see the Variable Product Equity Risk section below. In addition, Wealth
Management offers certain guaranteed benefits, primarily associated with variable annuity products, which increases the Company’ s
potential benefit exposure as the equity markets decline.
The Company is also subject to equity risk based upon the assets that support its pension plans. The asset allocation mix is reviewed on
a periodic basis. In order to minimize risk, the pension plans maintain a listing of permissible and prohibited investments. In addition,
the pension plans have certain concentration limits and investment quality requirements imposed on permissible investment options.
For further discussion of equity risk associated with the pension plans, see the Critical Accounting Estimates section of the MD&A
under “Pension and Other Postretirement Benefit Obligations” and Note 17 of the Notes to Consolidated Financial Statements.
Variable Product Equity Risk
The Company’ s variable products are significantly influenced by the U.S., Japanese, and other global equity markets. Increases or
declines in equity markets impact certain assets and liabilities related to the Company’ s variable products and the Company’ s earnings
derived from those products. The Company’ s variable products include variable annuity contracts, mutual funds, and variable life
insurance.
Generally, declines in equity markets will:
• reduce the value of assets under management and the amount of fee income generated from those assets;
• reduce the value of equity securities trading supporting the international variable annuities, the related policyholder funds and
benefits payable, and the amount of fee income generated from those variable annuities;
• increase the liability for GMWB benefits resulting in realized capital losses;
• increase the value of derivative assets used to hedge product guarantees resulting in realized capital gains;
• increase the costs of the hedging instruments we use in our hedging program;
• increase the Company’ s net amount at risk for GMDB and GMIB benefits;
• decrease the Company’ s actual gross profits, resulting in increased DAC amortization;
• increase the amount of required assets to be held backing variable annuity guarantees to maintain required regulatory reserve levels
and targeted risk based capital ratios;
• adversely affect customer sentiment toward equity-linked products, causing a decline in sales; and
• decrease the Company’ s estimated future gross profits. See Estimated Gross Profits Used in the Valuation and Amortization of
Assets and Liabilities Associated with Variable Annuity and Other Universal Life-Type Contracts within the Critical Accounting
Estimates section of the MD&A for further information.
Generally, increases in equity markets will reduce the value of derivative assets used to provide a macro hedge on statutory surplus,
resulting in realized capital losses during periods of market appreciation.
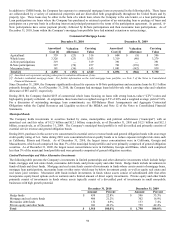
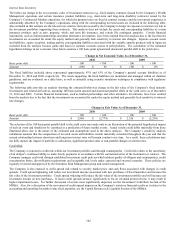
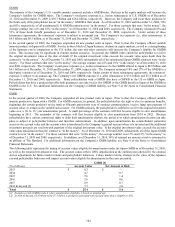
GMWB
The majority of the Company’ s U.S. and U.K. variable annuities, and a small portion of Japan’ s variable annuities, include a GMWB
rider. In the second quarter of 2009, the Company suspended all new sales in the U.K. and Japan. The Company’ s new variable annuity
product, launched in the U.S. in October 2009 does not offer a GMWB. Declines in equity markets will generally increase the
Company’ s liability for the in-force GMWB riders. As of December 31, 2010, U.S. GMWB account value was $44.8 billion and
International GMWB account value was $2.5 billion. As of December 31, 2009, U.S. GMWB account value was $45.5 billion and
International GMWB account value was $2.7 billion. A GMWB contract is “in the money” if the contract holder’ s guaranteed
remaining benefit (“GRB”) is greater than their current account value. As of December 31, 2010 and December 31, 2009, 35% and
48%, respectively, of all unreinsured U.S. GMWB contracts were “in the money”. For those contracts that were “in the money”, the
average contract was 9% and 13% “in the money” as of December 31, 2010 and 2009, respectively. For U.S. GMWB contracts that
were “in the money”, the Company’ s net amount at risk (i.e. GRB less account value), after reinsurance, as of December 31, 2010 and
December 31, 2009, was $1.1 billion and $2.6 billion, respectively. For U.K. and Japan GMWB contracts that were “in the money”, the
Company’ s net amount at risk, after reinsurance, as of December 31, 2010 and December 31, 2009, was $73 and $125, respectively.
However, the Company expects to incur these payments in the future only if the policyholder has an “in the money” GMWB at their
death or their account value is reduced to a specified level, through contractually permitted withdrawals and/or market declines. If the
account value is reduced to the specified level, the contract holder will receive an annuity equal to the remaining GRB. For the
Company’ s “life-time” GMWB products, this annuity can continue beyond the GRB. As the account value fluctuates with equity
market returns on a daily basis and the “life-time” GMWB payments can exceed the GRB, the ultimate amount to be paid by the
Company, if any, is uncertain and could be significantly more or less than the Company’ s current carried liability. For additional
information on the Company’ s GMWB liability, see Note 4a of the Notes to Consolidated Financial Statements.