The Hartford 2010 Annual Report Download - page 224
Download and view the complete annual report
Please find page 224 of the 2010 The Hartford annual report below. You can navigate through the pages in the report by either clicking on the pages listed below, or by using the keyword search tool below to find specific information within the annual report.-
 1
1 -
2
-
3
-
4
-
5
-
6
-
7
-
8
-
9
-
10
-
11
-
12
-
13
-
14
-
15
-
16
-
17
-
18
-
19
-
20
-
21
-
22
-
23
-
24
-
25
-
26
-
27
-
28
-
29
-
30
-
31
-
32
-
33
-
34
-
35
-
36
-
37
-
38
-
39
-
40
-
41
-
42
-
43
-
44
-
45
-
46
-
47
-
48
-
49
-
50
-
51
-
52
-
53
-
54
-
55
-
56
-
57
-
58
-
59
-
60
-
61
-
62
-
63
-
64
-
65
-
66
-
67
-
68
-
69
-
70
-
71
-
72
-
73
-
74
-
75
-
76
-
77
-
78
-
79
-
80
-
81
-
82
-
83
-
84
-
85
-
86
-
87
-
88
-
89
-
90
-
91
-
92
-
93
-
94
-
95
-
96
-
97
-
98
-
99
-
100
-
101
-
102
-
103
-
104
-
105
-
106
-
107
-
108
-
109
-
110
-
111
-
112
-
113
-
114
-
115
-
116
-
117
-
118
-
119
-
120
-
121
-
122
-
123
-
124
-
125
-
126
-
127
-
128
-
129
-
130
-
131
-
132
-
133
-
134
-
135
-
136
-
137
-
138
-
139
-
140
-
141
-
142
-
143
-
144
-
145
-
146
-
147
-
148
-
149
-
150
-
151
-
152
-
153
-
154
-
155
-
156
-
157
-
158
-
159
-
160
-
161
-
162
-
163
-
164
-
165
-
166
-
167
-
168
-
169
-
170
-
171
-
172
-
173
-
174
-
175
-
176
-
177
-
178
-
179
-
180
-
181
-
182
-
183
-
184
-
185
-
186
-
187
-
188
-
189
-
190
-
191
-
192
-
193
-
194
-
195
-
196
-
197
-
198
-
199
-
200
-
201
-
202
-
203
-
204
-
205
-
206
-
207
-
208
-
209
-
210
-
211
-
212
-
213
-
 214
214 -
 215
215 -
 216
216 -
 217
217 -
 218
218 -
 219
219 -
 220
220 -
 221
221 -
 222
222 -
 223
223 -
 224
224 -
 225
225 -
 226
226 -
 227
227 -
 228
228 -
 229
229 -
 230
230 -
 231
231 -
 232
232 -
 233
233 -
 234
234 -
235
-
236
-
237
-
238
-
239
-
240
-
241
-
242
-
243
-
244
-
245
-
246
-
247
-
248
 |
 |

THE HARTFORD FINANCIAL SERVICES GROUP, INC.
NOTES TO CONSOLIDATED FINANCIAL STATEMENTS (continued)
F-96
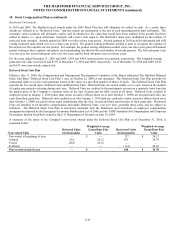
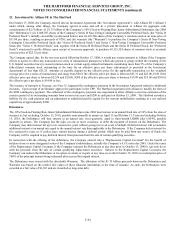
22. Restructuring, Severance and Other Costs
During the year ended December 31, 2009, the Company completed a review of several strategic alternatives with a goal of preserving
capital, reducing risk and stabilizing its ratings. These alternatives included the potential restructuring, discontinuation or disposition of
various business lines. Following that review, the Company announced that it would suspend all new sales in International’ s Japan and
European operations. The Company has also executed on plans to change the management structure of the organization and reorganized
the nature and focus of certain of the Company’ s operations. These plans resulted in termination benefits to current employees, costs to
terminate leases and other contracts and asset impairment charges. The Company completed these restructuring activities and executed
final payment during the year ended December 31, 2010.
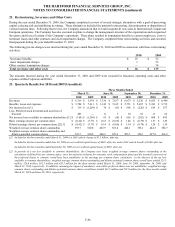
The following pre-tax charges were incurred during the years ended December 31, 2010 and 2009 in connection with these restructuring
activities:
2010 2009
Severance benefits $ 25 $ 52
Asset impairment charges 1 53
Other contract termination charges — 34
Total severance and other costs $ 26 $ 139
The amounts incurred during the year ended December 31, 2010 and 2009 were recorded in Insurance operating costs and other
expenses within Corporate and Other.
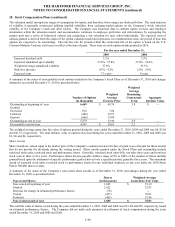
23. Quarterly Results For 2010 and 2009 (Unaudited)
Three Months Ended
March 31, June 30, September 30, December 31,
2010 2009 2010 2009 2010 2009 2010 2009
Revenues $6,319 $5,394 $3,336 $7,637 $6,673 $ 5,230 $6,055 $6,440
Benefits, losses and expenses $5,784 $7,411 $3,343 $7,619 $5,751 $ 5,687 $5,241 $5,712
Net income (loss) [1] $ 319 $ (1,209) $ 76 $ (15) $ 666 $ (220) $ 619 $ 557
Less: Preferred stock dividends and accretion of
discount 483 — 11 3 10 62 11 62
Net income (loss) available to common shareholders [1] $(164) $(1,209) $ 65 $ (18) $ 656 $ (282) $ 608 $ 495
Basic earnings (losses) per common share $(0.42) $(3.77) $0.15 $(0.06) $1.48 $ (0.79) $1.37 $1.29
Diluted earnings (losses) per common share [2] [3] $(0.42) $(3.77) $0.14 $(0.06) $1.34 $ (0.79) $1.24 $1.19
Weighted average common shares outstanding 393.7 320.8 443.9 325.4 444.1 356.1 444.3 382.7
Weighted average common shares outstanding and
dilutive potential common shares 393.7 320.8 480.2 325.4 495.3 356.1 497.8 416.2
[1] Included in the three months ended March 31, 2009 is a DAC unlock charge of $1.5 billion, after-tax.
Included in the three months ended June 30, 2009 are net realized capital losses of $649, after-tax, and a DAC unlock benefit of $360, after-tax.
Included in the three months ended September 30, 2009 are net realized capital losses of $885, after-tax.
[2] In periods of a net loss available to common shareholders, the Company uses basic weighted average common shares outstanding in the
calculation of diluted loss per common share, since the inclusion of shares for warrants, stock compensation plans and the assumed conversion of
the preferred shares to common would have been antidilutive to the earnings per common share calculation. In the absence of the net loss
available to common shareholders, weighted average common shares outstanding and dilutive potential common shares would have totaled 321.5
million, 326.6 million, 382.5 million and 428.5 million for the three months ended March 31, 2009, June 30, 2009, September 30, 2009, and
March 31, 2010 respectively. In addition, assuming the impact of mandatory convertible preferred shares was not antidilutive, weighted average
common shares outstanding and dilutive potential common shares would have totaled 431.9 million and 501.0 million for the three months ended
March 31, 2010 and June 30, 2010, respectively.