The Hartford 2010 Annual Report Download - page 76
Download and view the complete annual report
Please find page 76 of the 2010 The Hartford annual report below. You can navigate through the pages in the report by either clicking on the pages listed below, or by using the keyword search tool below to find specific information within the annual report.-
 1
1 -
2
-
3
-
4
-
5
-
6
-
7
-
8
-
9
-
10
-
11
-
12
-
13
-
14
-
15
-
16
-
17
-
18
-
19
-
20
-
21
-
22
-
23
-
24
-
25
-
26
-
27
-
28
-
29
-
30
-
31
-
32
-
33
-
34
-
35
-
36
-
37
-
38
-
39
-
40
-
41
-
42
-
43
-
44
-
45
-
46
-
47
-
48
-
49
-
50
-
51
-
52
-
53
-
54
-
55
-
56
-
57
-
58
-
59
-
60
-
61
-
62
-
63
-
64
-
65
-
 66
66 -
 67
67 -
 68
68 -
 69
69 -
 70
70 -
 71
71 -
 72
72 -
 73
73 -
 74
74 -
 75
75 -
 76
76 -
 77
77 -
 78
78 -
 79
79 -
 80
80 -
 81
81 -
 82
82 -
 83
83 -
 84
84 -
 85
85 -
 86
86 -
87
-
88
-
89
-
90
-
91
-
92
-
93
-
94
-
95
-
96
-
97
-
98
-
99
-
100
-
101
-
102
-
103
-
104
-
105
-
106
-
107
-
108
-
109
-
110
-
111
-
112
-
113
-
114
-
115
-
116
-
117
-
118
-
119
-
120
-
121
-
122
-
123
-
124
-
125
-
126
-
127
-
128
-
129
-
130
-
131
-
132
-
133
-
134
-
135
-
136
-
137
-
138
-
139
-
140
-
141
-
142
-
143
-
144
-
145
-
146
-
147
-
148
-
149
-
150
-
151
-
152
-
153
-
154
-
155
-
156
-
157
-
158
-
159
-
160
-
161
-
162
-
163
-
164
-
165
-
166
-
167
-
168
-
169
-
170
-
171
-
172
-
173
-
174
-
175
-
176
-
177
-
178
-
179
-
180
-
181
-
182
-
183
-
184
-
185
-
186
-
187
-
188
-
189
-
190
-
191
-
192
-
193
-
194
-
195
-
196
-
197
-
198
-
199
-
200
-
201
-
202
-
203
-
204
-
205
-
206
-
207
-
208
-
209
-
210
-
211
-
212
-
213
-
214
-
215
-
216
-
217
-
218
-
219
-
220
-
221
-
222
-
223
-
224
-
225
-
226
-
227
-
228
-
229
-
230
-
231
-
232
-
233
-
234
-
235
-
236
-
237
-
238
-
239
-
240
-
241
-
242
-
243
-
244
-
245
-
246
-
247
-
248
 |
 |

76
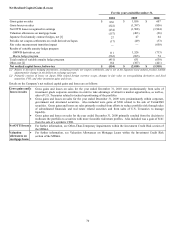
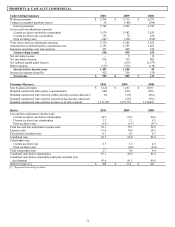
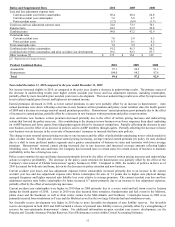
CONSUMER MARKETS
Operating Summary 2010 2009 2008
Written premiums $ 3,886 $ 3,995 $ 3,933
Change in unearned premium reserve (61) 36 (2)
Earned premiums 3,947 3,959 3,935
Losses and loss adjustment expenses
Current accident year before catastrophes 2,737 2,707 2,552
Current accident year catastrophes 300 228 258
Prior accident years (86) (33) (52)
Total losses and loss adjustment expenses 2,951 2,902 2,758
Amortization of deferred policy acquisition costs 667 674 633
Insurance operating costs and expenses 290 273 266
Underwriting results 39 110 278
Net servicing income 35 29 26
Net investment income 187 178 207
Net realized capital gains (losses) — (52) (319)
Other expenses (66) (77) (63)
Income before income taxes 195 188 129
Income tax expense 52 48 27
Net income $ 143 $ 140 $ 102
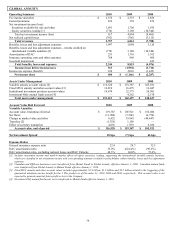
Written Premiums 2010 2009 2008
Product Line
Automobile $ 2,745 $ 2,877 $ 2,837
Homeowners 1,141 1,118 1,096
Total $ 3,886 $ 3,995 $ 3,933
Earned Premiums
Product Line
Automobile $ 2,806 $ 2,857 $ 2,833
Homeowners 1,141 1,102 1,102
Total $ 3,947 $ 3,959 $ 3,935
Premium Measures 2010 2009 2008
Policies in force at year end
Automobile 2,226,351 2,395,421 2,323,882
Homeowners 1,426,107 1,488,408 1,455,954
Total policies in force at year end 3,652,458 3,883,829 3,779,836
New business premium
Automobile $311 $455 $ 364
Homeowners $106 $149 $ 106
Policy count retention
Automobile 83% 86% 86%
Homeowners 85% 86% 87%
Renewal written pricing increase
Automobile 6% 3% 4%
Homeowners 10% 5% 6%
Renewal earned pricing increase
Automobile 5% 4% 4%
Homeowners 7% 6% 5%