The Hartford 2010 Annual Report Download - page 79
Download and view the complete annual report
Please find page 79 of the 2010 The Hartford annual report below. You can navigate through the pages in the report by either clicking on the pages listed below, or by using the keyword search tool below to find specific information within the annual report.-
 1
1 -
2
-
3
-
4
-
5
-
6
-
7
-
8
-
9
-
10
-
11
-
12
-
13
-
14
-
15
-
16
-
17
-
18
-
19
-
20
-
21
-
22
-
23
-
24
-
25
-
26
-
27
-
28
-
29
-
30
-
31
-
32
-
33
-
34
-
35
-
36
-
37
-
38
-
39
-
40
-
41
-
42
-
43
-
44
-
45
-
46
-
47
-
48
-
49
-
50
-
51
-
52
-
53
-
54
-
55
-
56
-
57
-
58
-
59
-
60
-
61
-
62
-
63
-
64
-
65
-
66
-
67
-
68
-
 69
69 -
 70
70 -
 71
71 -
 72
72 -
 73
73 -
 74
74 -
 75
75 -
 76
76 -
 77
77 -
 78
78 -
 79
79 -
 80
80 -
 81
81 -
 82
82 -
 83
83 -
 84
84 -
 85
85 -
 86
86 -
 87
87 -
 88
88 -
 89
89 -
90
-
91
-
92
-
93
-
94
-
95
-
96
-
97
-
98
-
99
-
100
-
101
-
102
-
103
-
104
-
105
-
106
-
107
-
108
-
109
-
110
-
111
-
112
-
113
-
114
-
115
-
116
-
117
-
118
-
119
-
120
-
121
-
122
-
123
-
124
-
125
-
126
-
127
-
128
-
129
-
130
-
131
-
132
-
133
-
134
-
135
-
136
-
137
-
138
-
139
-
140
-
141
-
142
-
143
-
144
-
145
-
146
-
147
-
148
-
149
-
150
-
151
-
152
-
153
-
154
-
155
-
156
-
157
-
158
-
159
-
160
-
161
-
162
-
163
-
164
-
165
-
166
-
167
-
168
-
169
-
170
-
171
-
172
-
173
-
174
-
175
-
176
-
177
-
178
-
179
-
180
-
181
-
182
-
183
-
184
-
185
-
186
-
187
-
188
-
189
-
190
-
191
-
192
-
193
-
194
-
195
-
196
-
197
-
198
-
199
-
200
-
201
-
202
-
203
-
204
-
205
-
206
-
207
-
208
-
209
-
210
-
211
-
212
-
213
-
214
-
215
-
216
-
217
-
218
-
219
-
220
-
221
-
222
-
223
-
224
-
225
-
226
-
227
-
228
-
229
-
230
-
231
-
232
-
233
-
234
-
235
-
236
-
237
-
238
-
239
-
240
-
241
-
242
-
243
-
244
-
245
-
246
-
247
-
248
 |
 |

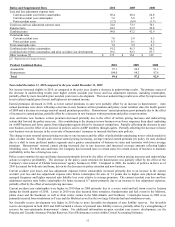
79
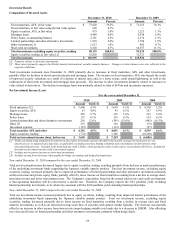
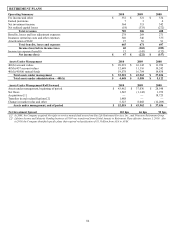
GLOBAL ANNUITY
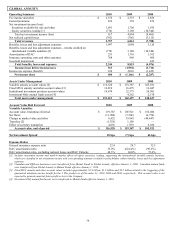
Operating Summary 2010 2009 2008
Fee income and other $ 2,376 $ 2,335 $ 2,856
Earned premiums 226 338 876
Net investment income (loss):
Securities available-for sale and other 1,691 1,706 1,935
Equity securities, trading [1] (774) 3,188 (10,340)
Total net investment income (loss) 917 4,894 (8,405)
Net realized capital losses (762) (706) (3,115)
Total revenues 2,757 6,861 (7,788)
Benefits, losses and loss adjustment expenses 1,997 3,089 3,120
Benefits, losses and loss adjustment expenses – returns credited on
international variable annuities [1] (774) 3,188 (10,340)
Amortization of DAC 253 1,716 1,762
Insurance operating costs and other expenses 768 860 960
Goodwill impairment — — 422
Total benefits, losses and expenses 2,244 8,853 (4,076)
Income (loss) before income taxes 513 (1,992) (3,712)
Income tax expense (benefit) 109 (826) (1,425)
Net income (loss) $ 404 $ (1,166) $ (2,287)
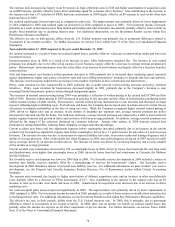
Assets Under Management
2010
2009
2008
Variable annuity account values [2] $ 116,520 $ 119,387 $ 105,921
Fixed MVA annuity and other account values [3] 16,819 16,475 16,047
Institutional investment products account values 19,674 22,373 24,081
Investment-Only mutual funds assets [4] — 4,262 2,578
Total assets under management $ 153,013 $ 162,497 $ 148,627
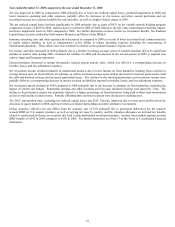
Account Value Roll Forward
2010
2009
2008
Variable Annuities
Account value, beginning of period $ 119,387 $ 105,921 $ 156,084
Net flows (11,980) (7,506) (6,750)
Change in market value and other 6,432 19,943 (49,447)
Transfers [2] (1,355) 1,188 —
Effect of currency translation 4,036 (159) 6,034
Account value, end of period $ 116,520 $ 119,387 $ 105,921
Net Investment Spread 18 bps (7) bps 46 bps
Expense Ratios
General insurance expense ratio 22.4 29.7 32.5
DAC amortization ratio 33.0% (624.4%) (90.3%)
DAC amortization ratio, excluding realized losses and DAC Unlocks 48.3% 66.0% 73.6%
[1] Includes investment income and mark-to-market effects of equity securities, trading, supporting the international variable annuity business,
which are classified in net investment income with corresponding amounts credited to policyholders within benefits, losses and loss adjustment
expenses.
[2] Canadian and Offshore businesses were transferred from Mutual Funds to Global Annuity, effective January 1, 2009. Canadian mutual funds
were transferred from Global Annuity to Mutual Funds effective January 1, 2010.
[3] Fixed MVA annuity and other account values includes approximately $1.9 billion, $1.8 billion and $2.2 billion related to the triggering of the
guaranteed minimum income benefit for the 3 Win product as of December 31, 2010, 2009 and 2008, respectively. This account value is not
expected to generate material future profit or loss to the Company.
[4] Investment-Only mutual fund assets were transferred to Mutual Funds effective January 1, 2010.