The Hartford 2010 Annual Report Download - page 36
Download and view the complete annual report
Please find page 36 of the 2010 The Hartford annual report below. You can navigate through the pages in the report by either clicking on the pages listed below, or by using the keyword search tool below to find specific information within the annual report.-
 1
1 -
2
-
3
-
4
-
5
-
6
-
7
-
8
-
9
-
10
-
11
-
12
-
13
-
14
-
15
-
16
-
17
-
18
-
19
-
20
-
21
-
22
-
23
-
24
-
25
-
 26
26 -
 27
27 -
 28
28 -
 29
29 -
 30
30 -
 31
31 -
 32
32 -
 33
33 -
 34
34 -
 35
35 -
 36
36 -
 37
37 -
 38
38 -
 39
39 -
 40
40 -
 41
41 -
 42
42 -
 43
43 -
 44
44 -
 45
45 -
 46
46 -
47
-
48
-
49
-
50
-
51
-
52
-
53
-
54
-
55
-
56
-
57
-
58
-
59
-
60
-
61
-
62
-
63
-
64
-
65
-
66
-
67
-
68
-
69
-
70
-
71
-
72
-
73
-
74
-
75
-
76
-
77
-
78
-
79
-
80
-
81
-
82
-
83
-
84
-
85
-
86
-
87
-
88
-
89
-
90
-
91
-
92
-
93
-
94
-
95
-
96
-
97
-
98
-
99
-
100
-
101
-
102
-
103
-
104
-
105
-
106
-
107
-
108
-
109
-
110
-
111
-
112
-
113
-
114
-
115
-
116
-
117
-
118
-
119
-
120
-
121
-
122
-
123
-
124
-
125
-
126
-
127
-
128
-
129
-
130
-
131
-
132
-
133
-
134
-
135
-
136
-
137
-
138
-
139
-
140
-
141
-
142
-
143
-
144
-
145
-
146
-
147
-
148
-
149
-
150
-
151
-
152
-
153
-
154
-
155
-
156
-
157
-
158
-
159
-
160
-
161
-
162
-
163
-
164
-
165
-
166
-
167
-
168
-
169
-
170
-
171
-
172
-
173
-
174
-
175
-
176
-
177
-
178
-
179
-
180
-
181
-
182
-
183
-
184
-
185
-
186
-
187
-
188
-
189
-
190
-
191
-
192
-
193
-
194
-
195
-
196
-
197
-
198
-
199
-
200
-
201
-
202
-
203
-
204
-
205
-
206
-
207
-
208
-
209
-
210
-
211
-
212
-
213
-
214
-
215
-
216
-
217
-
218
-
219
-
220
-
221
-
222
-
223
-
224
-
225
-
226
-
227
-
228
-
229
-
230
-
231
-
232
-
233
-
234
-
235
-
236
-
237
-
238
-
239
-
240
-
241
-
242
-
243
-
244
-
245
-
246
-
247
-
248
 |
 |

36
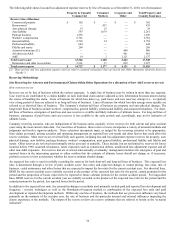
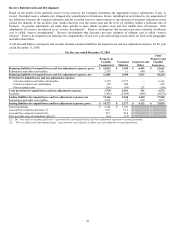
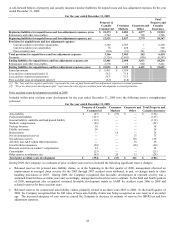
The following table shows loss and loss adjustment expense reserves by line of business as of December 31, 2010, net of reinsurance:
Property & Casualty
Commercial
Consumer
Markets
Corporate and
Other
Total Property and
Casualty Insurance
Reserve Line of Business
Commercial property $ 162 $ — $ — $ 162
Homeowners’ — 435 — 435
Auto physical damage 13 15 — 28
Auto liability 587 1,674 — 2,261
Package business 1,256 — — 1,256
Workers’ compensation 6,701 — — 6,701
General liability 2,720 34 — 2,754
Professional liability 644 — — 644
Fidelity and surety 269 — — 269
Assumed reinsurance [1] — — 400 400
All other non-A&E — — 901 901
A&E 14 2 2,121 2,137
Total reserves-net 12,366 2,160 3,422 17,948
Reinsurance and other recoverables 2,361 17 699 3,077
Total reserves-gross $ 14,727 $ 2,177 $ 4,121 $ 21,025
[1] These net loss and loss adjustment expense reserves relate to assumed reinsurance that was moved into Other Operations (formerly known as
“HartRe”).
Reserving Methodology
(See Reserving for Asbestos and Environmental Claims within Other Operations for a discussion of how A&E reserves are set)
How reserves are set
Reserves are set by line of business within the various segments. A single line of business may be written in more than one segment.
Case reserves are established by a claims handler on each individual claim and are adjusted as new information becomes known during
the course of handling the claim. Lines of business for which loss data (e.g., paid losses and case reserves) emerge (i.e., is reported)
over a long period of time are referred to as long-tail lines of business. Lines of business for which loss data emerge more quickly are
referred to as short-tail lines of business. The Company’ s shortest-tail lines of business are property and auto physical damage. The
longest tail lines of business include workers’ compensation, general liability, professional liability and assumed reinsurance. For short-
tail lines of business, emergence of paid loss and case reserves is credible and likely indicative of ultimate losses. For long-tail lines of
business, emergence of paid losses and case reserves is less credible in the early periods and, accordingly, may not be indicative of
ultimate losses.
Company reserving actuaries, who are independent of the business units, regularly review reserves for both current and prior accident
years using the most current claim data. For most lines of business, these reserve reviews incorporate a variety of actuarial methods and
judgments and involve rigorous analysis. These selections incorporate input, as judged by the reserving actuaries to be appropriate,
from claims personnel, pricing actuaries and operating management on reported loss cost trends and other factors that could affect the
reserve estimates. Most reserves are reviewed fully each quarter, including loss and loss adjustment expense reserves for property, auto
physical damage, auto liability, package business, workers’ compensation, most general liability, professional liability and fidelity and
surety. Other reserves are reviewed semi-annually (twice per year) or annually. These include, but are not limited to, reserves for losses
incurred before 1990, assumed reinsurance, latent exposures such as construction defects, unallocated loss adjustment expense and all
other non-A&E exposures. For reserves that are reviewed semi-annually or annually, management monitors the emergence of paid and
reported losses in the intervening quarters to either confirm that the estimate of ultimate losses should not change or, if necessary,
perform a reserve review to determine whether the reserve estimate should change.
An expected loss ratio is used in initially recording the reserves for both short-tail and long-tail lines of business. This expected loss
ratio is determined through a review of prior accident years’ loss ratios and expected changes to earned pricing, loss costs, mix of
business, ceded reinsurance and other factors that are expected to impact the loss ratio for the current accident year. For short-tail lines,
IBNR for the current accident year is initially recorded as the product of the expected loss ratio for the period, earned premium for the
period and the proportion of losses expected to be reported in future calendar periods for the current accident period. For long-tailed
lines, IBNR reserves for the current accident year are initially recorded as the product of the expected loss ratio for the period and the
earned premium for the period, less reported losses for the period.
In addition to the expected loss ratio, the actuarial techniques or methods used primarily include paid and reported loss development and
frequency / severity techniques as well as the Bornhuetter-Ferguson method (a combination of the expected loss ratio and paid
development or reported development method). Within any one line of business, the methods that are given more influence vary based
primarily on the maturity of the accident year, the mix of business and the particular internal and external influences impacting the
claims experience or the methods. The output of the reserve reviews are reserve estimates that are referred to herein as the “actuarial
indication”.