The Hartford 2010 Annual Report Download - page 158
Download and view the complete annual report
Please find page 158 of the 2010 The Hartford annual report below. You can navigate through the pages in the report by either clicking on the pages listed below, or by using the keyword search tool below to find specific information within the annual report.-
 1
1 -
2
-
3
-
4
-
5
-
6
-
7
-
8
-
9
-
10
-
11
-
12
-
13
-
14
-
15
-
16
-
17
-
18
-
19
-
20
-
21
-
22
-
23
-
24
-
25
-
26
-
27
-
28
-
29
-
30
-
31
-
32
-
33
-
34
-
35
-
36
-
37
-
38
-
39
-
40
-
41
-
42
-
43
-
44
-
45
-
46
-
47
-
48
-
49
-
50
-
51
-
52
-
53
-
54
-
55
-
56
-
57
-
58
-
59
-
60
-
61
-
62
-
63
-
64
-
65
-
66
-
67
-
68
-
69
-
70
-
71
-
72
-
73
-
74
-
75
-
76
-
77
-
78
-
79
-
80
-
81
-
82
-
83
-
84
-
85
-
86
-
87
-
88
-
89
-
90
-
91
-
92
-
93
-
94
-
95
-
96
-
97
-
98
-
99
-
100
-
101
-
102
-
103
-
104
-
105
-
106
-
107
-
108
-
109
-
110
-
111
-
112
-
113
-
114
-
115
-
116
-
117
-
118
-
119
-
120
-
121
-
122
-
123
-
124
-
125
-
126
-
127
-
128
-
129
-
130
-
131
-
132
-
133
-
134
-
135
-
136
-
137
-
138
-
139
-
140
-
141
-
142
-
143
-
144
-
145
-
146
-
147
-
 148
148 -
 149
149 -
 150
150 -
 151
151 -
 152
152 -
 153
153 -
 154
154 -
 155
155 -
 156
156 -
 157
157 -
 158
158 -
 159
159 -
 160
160 -
 161
161 -
 162
162 -
 163
163 -
 164
164 -
 165
165 -
 166
166 -
 167
167 -
 168
168 -
169
-
170
-
171
-
172
-
173
-
174
-
175
-
176
-
177
-
178
-
179
-
180
-
181
-
182
-
183
-
184
-
185
-
186
-
187
-
188
-
189
-
190
-
191
-
192
-
193
-
194
-
195
-
196
-
197
-
198
-
199
-
200
-
201
-
202
-
203
-
204
-
205
-
206
-
207
-
208
-
209
-
210
-
211
-
212
-
213
-
214
-
215
-
216
-
217
-
218
-
219
-
220
-
221
-
222
-
223
-
224
-
225
-
226
-
227
-
228
-
229
-
230
-
231
-
232
-
233
-
234
-
235
-
236
-
237
-
238
-
239
-
240
-
241
-
242
-
243
-
244
-
245
-
246
-
247
-
248
 |
 |
THE HARTFORD FINANCIAL SERVICES GROUP, INC.
NOTES TO CONSOLIDATED FINANCIAL STATEMENTS (continued)
F-30
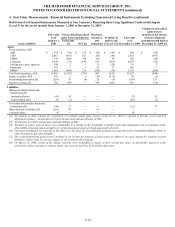
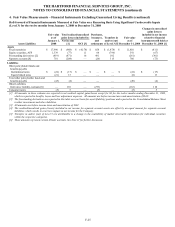
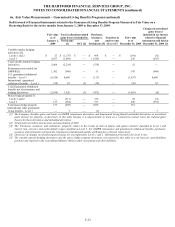
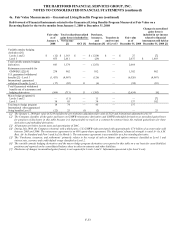
4a. Fair Value Measurements – Guaranteed Living Benefits (continued)
As many guaranteed benefit obligations are relatively new in the marketplace, actual policyholder behavior experience is limited. As a
result, estimates of future policyholder behavior are subjective and based on analogous internal and external data. As markets change,
mature and evolve and actual policyholder behavior emerges, management continually evaluates the appropriateness of its assumptions
for this component of the fair value model.
On a daily basis, the Company updates capital market assumptions used in the GMWB liability model such as interest rates and equity
indices. On a weekly basis, the blend of implied equity index volatilities is updated. The Company continually monitors various aspects
of policyholder behavior and may modify certain of its assumptions, including living benefit lapses and withdrawal rates, if credible
emerging data indicates that changes are warranted. At a minimum, all policyholder behavior assumptions are reviewed and updated, as
appropriate, in conjunction with the completion of the Company’ s comprehensive study to refine its estimate of future gross profits
during the third quarter of each year.
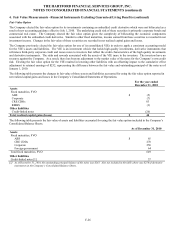
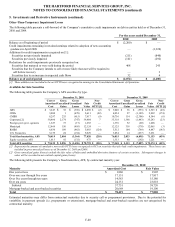
Credit Standing Adjustment
This assumption makes an adjustment that market participants would make, in determining fair value, to reflect the risk that guaranteed
benefit obligations or the GMWB reinsurance recoverables will not be fulfilled (“nonperformance risk”). As a result of sustained
volatility in the Company’ s credit default spreads, during 2009 the Company changed its estimate of the Credit Standing Adjustment to
incorporate a blend of observable Company and reinsurer credit default spreads from capital markets, adjusted for market recoverability.
Prior to the first quarter of 2009, the Company calculated the Credit Standing Adjustment by using default rates published by rating
agencies, adjusted for market recoverability. The credit standing adjustment assumption, net of reinsurance, and exclusive of the impact
of the credit standing adjustment on other market inputs, resulted in pre-tax realized gains/(losses) of $(10), $26 and $10, for the years
ended December 31, 2010, 2009 and 2008, respectively. As of December 31, 2010 the credit standing adjustment was $26.
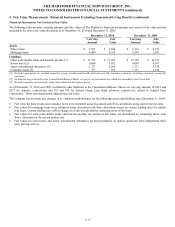
Margins
The behavior risk margin adds a margin that market participants would require, in determining fair value, for the risk that the
Company’ s assumptions about policyholder behavior could differ from actual experience. The behavior risk margin is calculated by
taking the difference between adverse policyholder behavior assumptions and best estimate assumptions.
Assumption updates, including policyholder behavior assumptions, affected best estimates and margins for a total pre-tax realized gain
of $159, $566 and $470 for the years ended December 31, 2010, 2009 and 2008, respectively. As of December 31, 2010 the behavior
risk margin was $565.
In addition to the non-market-based updates described above, the Company recognized non-market-based updates driven by the relative
outperformance (underperformance) of the underlying actively managed funds as compared to their respective indices resulting in pre-
tax realized gain (loss) of approximately $104, $550 and $(355) for the years ended December 31, 2010, 2009 and 2008, respectively.